by
CMA
- Updated March 19th, 2007
This article contains an analysis of the quality of WIRCam data as on February 2007. This analysis had been carried out using PI data available to TERAPIX at that time.
PSF homogeneity on the detectors
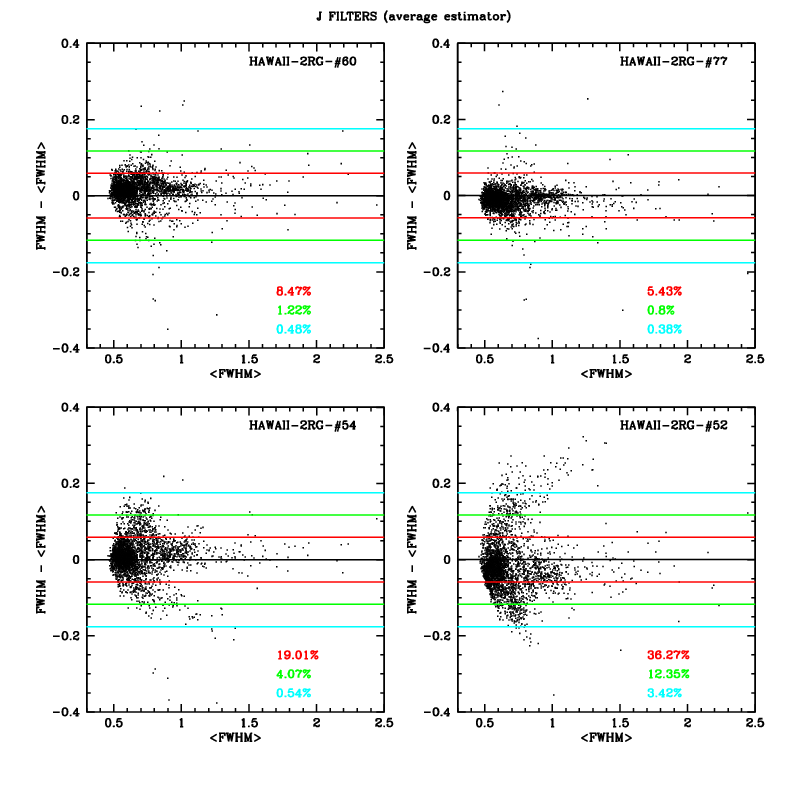
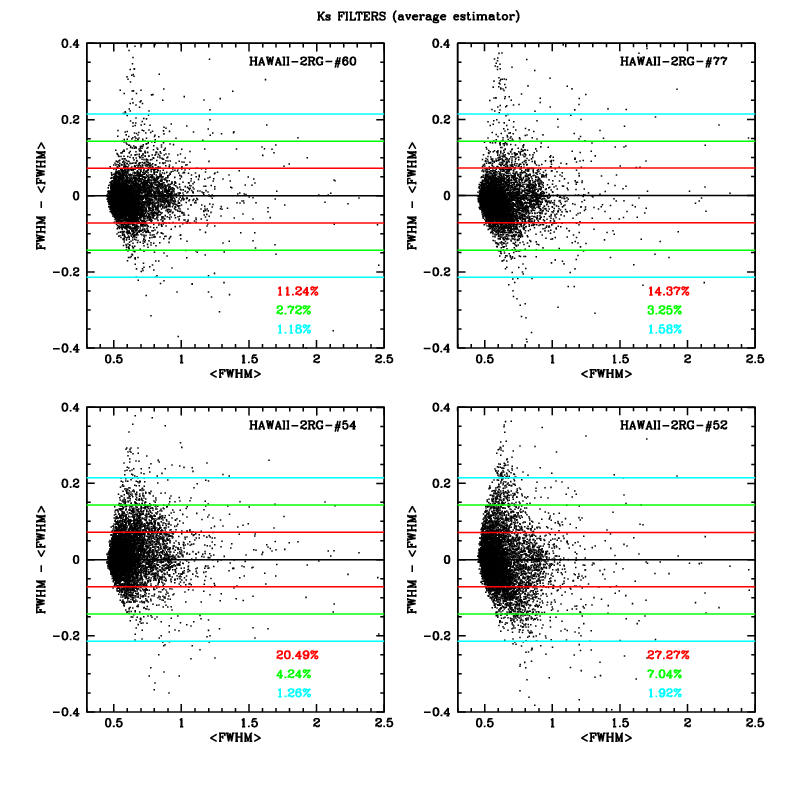
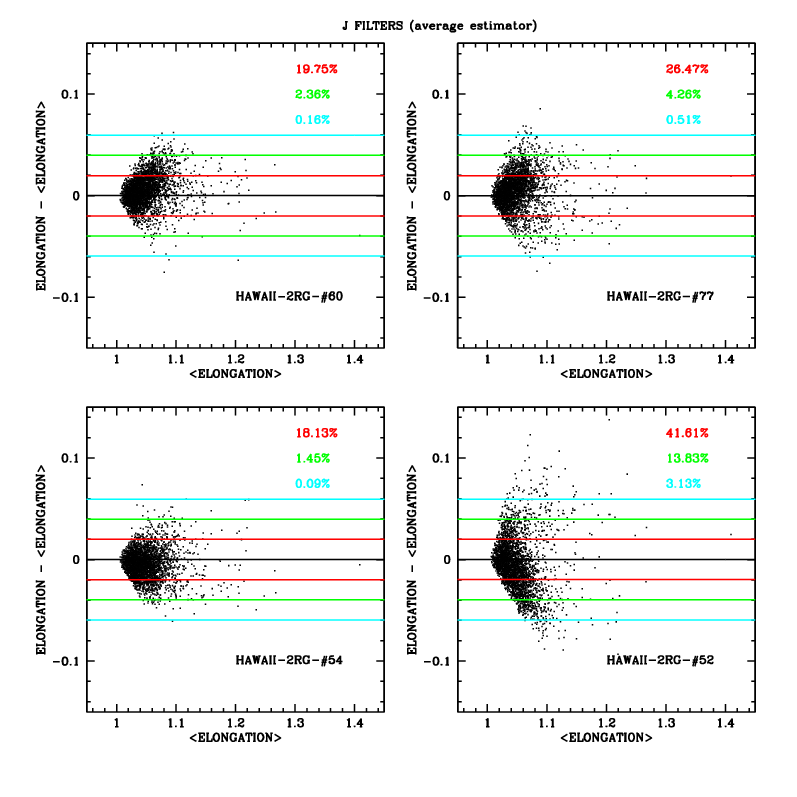
The homogeneity of the Full Width Half Maximum and Elongation of the Point Spread Function over the four WIRCam detectors is analized in this section.
Using all available data in J and Ks band, I computed for every image the mean and its variance of the FWHM (or ELONGATION) on the four chips. Then, I plotted the difference of the measured FWHM (or ELONGATION) and the mean versus the mean itself. I computed the variance of variances on all images and I defined SIGMA the square root of this total variance. Red lines are 1SIGMA distance from average, green lines 2SIGMA distance, cyan lines 3sigma distance. The percentage of points outside these intervals is marked with the same color.
Background noise homogeneity on the detectors after sky subtraction
The properties and homogeneity of the background noise over the four WIRCam detectors is analized in this section.
| Using Willott D3 data in Ks band (RUNIDs 06AC01 06AC99), I produced the histogram of all SExtractor global sigma background evaluation. The red histogram represents the first pass sky subtraction, the black one represents the double pass sky subtraction. The two histograms have no significant differences, as expected. Bimodality in the distribution corresponds to different background level in different epoque exposures. | 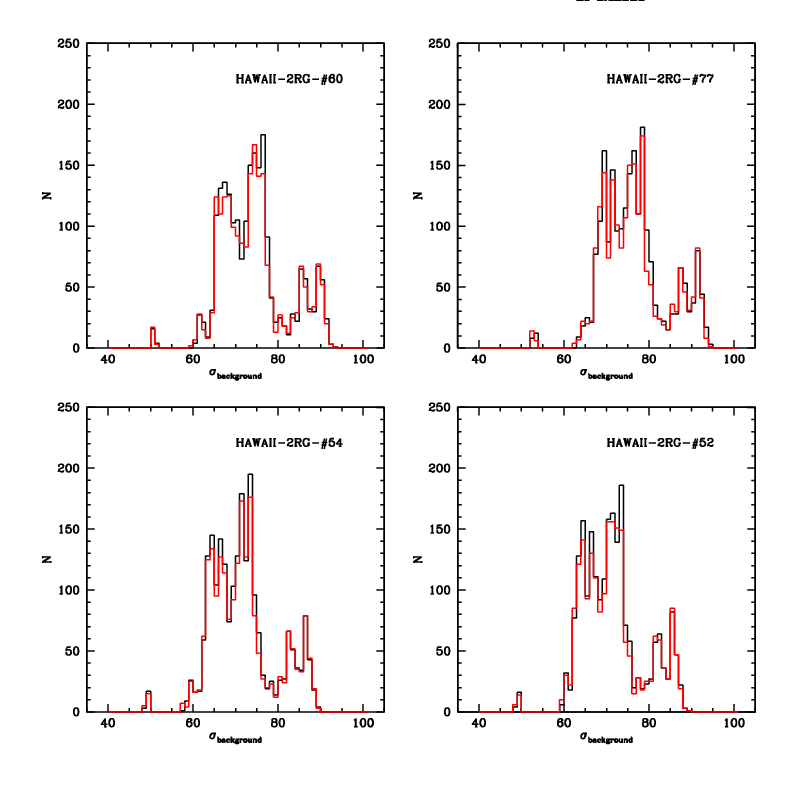
|
| 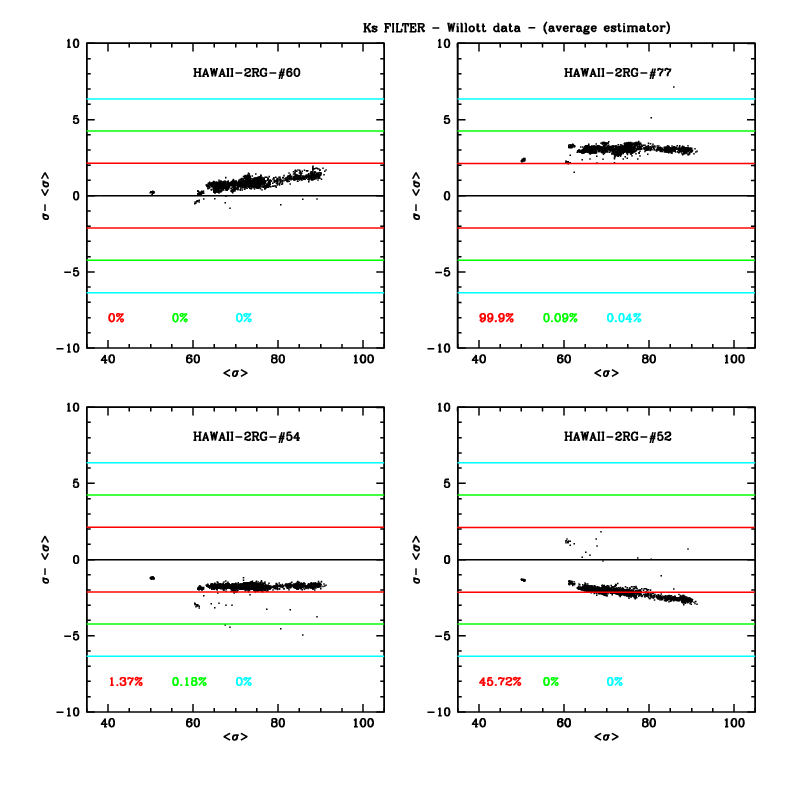
| Using the same data, as for PSF analysis, I computed for every image the mean and its variance of the global sigma background evaluated by SExtractor on the four chips. Then, I plotted the difference of the measured sigma and the mean versus the mean itself. I computed the variance of variances on all images and I defined SIGMA the square root of this total variance. Red lines are 1SIGMA distance from average, green lines 2SIGMA distance, cyan lines 3sigma distance. The percentage of points outside these intervals is marked with the same color. Systematic deviations from the mean corresponds to chip by chip gain differences. |