6.4 The QualityFITS input and output products
QualityFITS is a Terapix quality assessment tool for FITS images. During CFHTLS T0007 production, it is
used to assess whether individual CFHT input images and the CFHTLS output stacks meet the survey
specifications. QualityFITS also produces the input weight-map images as well as the input .ldac
catalogues.
The quality assessments are done from a visual inspection of QualityFITS outputs and from a series of statistics,
tables and plots. An overview and a quick-look image quality assessments can be made using the QualityFITS web
page. This “ID-card” for each image is produced automatically and is used to grade all images through the Youpi user
interface .
The information returned by QualityFITS depends on the type of images (Multi-extension fits (MEF) or single
extension FITS, the type of detectors (single CCD, mosaic of CCDs) and the origin of images. Depending on the
steps of the processing (evaluation of input images or of final stacks), they are referenced as QualityFITS-in (or
QFITS-in) or QualityFITS-out (or QFITS-out) products.
As a general rule any CFHT images entering or leaving the Terapix center is passes through QualityFITS-in or
QualityFITS-out processing steps. 7042 CFHTLS input images and the 2276 T0007 output images were
evaluated using this tool.
The QualityFITS data products are images, tables and plots:
- the FITS weight-map image, using WeightWatcher (?), in a multiple or single extension FITS
format, like the input image;
- the .ldac catalogue, using SExtractor;
- an analysis of the shape and spatial variation of the PSF using PSFEX, sampled over the whole
field (QualityFITS-out), or CCD by CCD for a mosaic (as for QualityFITS-in in the case of
MegaCam input images);
- an analysis of the sky background over the whole field of CCD by CCD for a mosaic;
- an analysis of galaxy and stellar counts, based on an automatic blind star-galaxy separation from a
rh -magnitude
diagram. The counts are shown on separate plots and compared to expectations: for the galaxies,
they are compared to published results of CFHTLS Deep galaxy counts with the MegaCam filters;
for stars, the counts are compared to Bahcall-Soneira models (?);
- an analysis of the astrometry of images, using SCAMP. For CFHT input images (QualityFITS-in),
the astrometry analysis is approximate, and just relies on the FITS keywords. For CFHTLS stacks
(QualityFITS-out), the analysis is based on a comparison between the CFHTLS and the 2MASS
source catalogues;
- a properly oriented (in case of reversed detector images due to flipped positions of output
amplifiers), scaled and astrometrically calibrate binned view of each CCD and of the whole
MegaCam field;
- close up views of the central and the four corner regions of the MegaCam image. The views are
unbinned 512×512 pixels JPEG sub-images of the five regions, but is sometimes expanded to
1024×1024 pixels when necessary;
- a series of tables that contain information from the image FITS header, or statistics on the seeing,
the background, the number of detections, either over the whole image or CCD by CCD for a
mosaic.
The QualityFITS output files are all public. The QualityFITS QA pages are available from the synoptic table.
The T0007 synoptic table is a convenient way to have a quick look at the images.
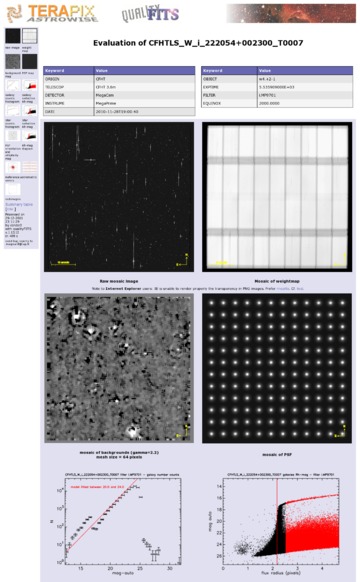
| Figure 48: | QFITS-out page of the W4 CFHTLS_W_i_222054+002300 stack. The top table summarises the
images origin and the nature of the stack. The next images show, from top left to bottom right: binned images of
the stack, its weight-map, and the sky background; the PSF over the MegaCam field. The plots at the bottom show
the galaxy counts (left) derived from the .ldaccatalogue. The galaxies are extracted from a blind selection of the
sources shown on the right rh -mag plot (red points). The red line on the galaxy count plot is the expectation. |
|
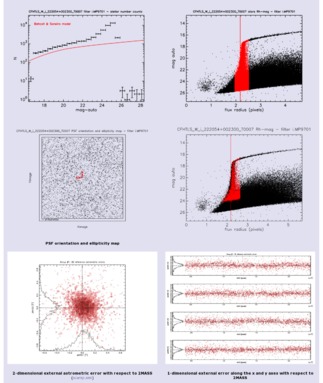
| Figure 49: | QFITS-out page of the same field (cont’d). The clickable plots show, from top left to bottom right,
the stellar-counts (left) derived from a blind selection of red sources shown on the right rh - magnitude plot.
The red line is the predictions of the Bahcall-Soneira model. The plot on the middle panel shows the amplitude
((a2 -b2)∕(a2 + b2) = length of lines) and the orientation (= orientation of lines) of the stellar ellipticity vectors
over the MegaCam field. The seelcted sources are the red points shown on the right rh - magnitude plot. The
plots at the bottom are the 2-dimensional (left) and 1-dimensional astrometric errors of sources with respect to the
2MASS catalogue. They are produced by running SCAMP in a simple diagnostic mode (-match n -solve_astrom n
-solve_photom n). |
|
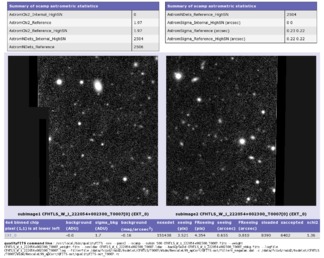
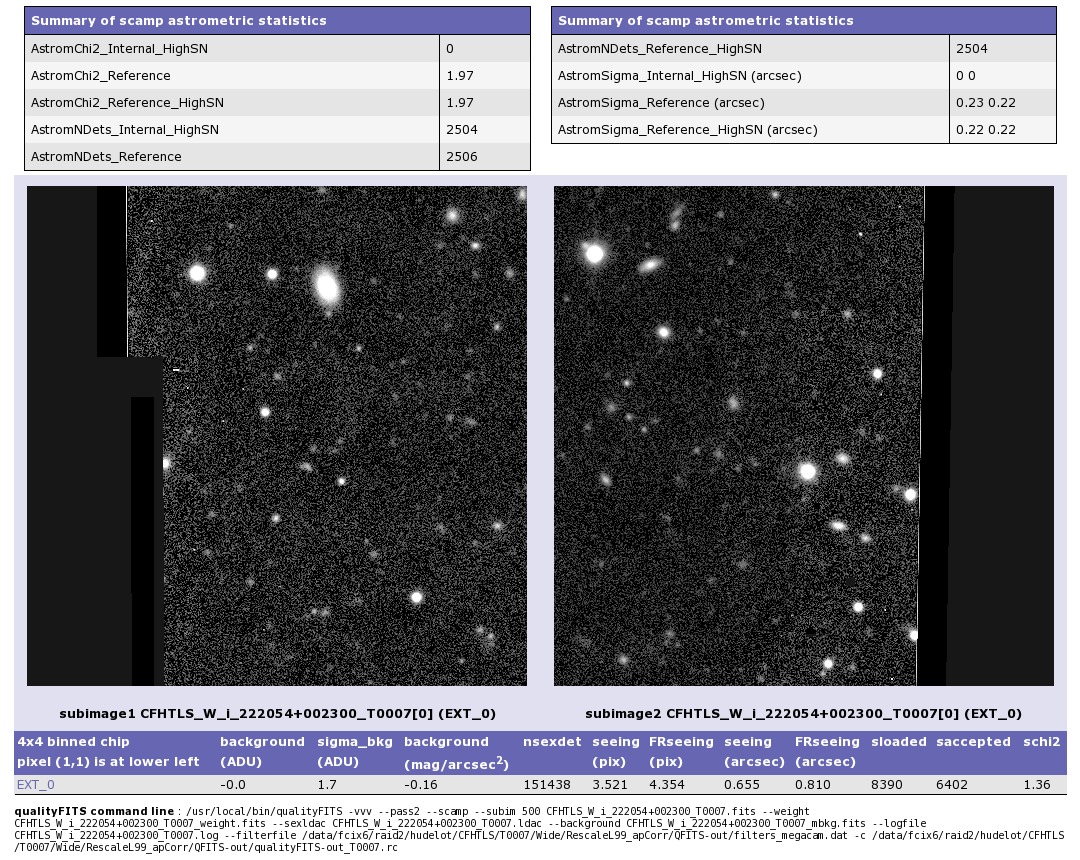
| Figure 50: | QFITS-out page of the same field (cont’d). The clickable images are full resolution sub-images of the bottom left corners of the stack. The table below
summarises some basic information of the stack: sky background, mean seeing, number of sources. |
|