4.1 Overview
The T0007 release of the Wide survey covers 171 MegaCam pointings (or tiles) divided into the W1, W2, W3
and W4 fields and is complete in all filters. In total there are 855 u*,g,r,i∕y and z stacks and 171
chisquared images (2052 including the weight-maps). The positions and geometry of the four Wide
fields comprising T0007, namely W1, W2, W3 and W4, are shown on Fig. 19 and summarized
in Table 3. Table 6 lists the effective area, after masking, of the four Wide patches in each of the
filters.
The image selection criteria applied to the 6378 CFHTLS Validated images for the production of the T0007
CFHTLS Wide survey are the following:
- CFHTLS L02 and L05 Wide observation period: between May 26, 2003 and November, 2008;
VIPERS-DDT images (2009BD97);
- Terapix selection of CFHT Validated images, with QualityFITS grade A or B (images within the
survey specifications);
- exposure time > 60 s;
- airmass < 1.7;
- few images with missing data on more than one entire CCD have been removed from the parent
sample. However, all images with missing data on only half of CCD detectors have been preserved;
- all pre-Wide survey images and all photometric short exposures. They will be included in the set
of images used for the SCAMP astrometric/photometric calibration process;
- images with seeing (FWHM )
< 1.4” in u*, and < 1.2” in g, r, i and z are selected for the calibration process;
- images with seeing (FWHM) < 1.3” in u*, and < 0.95” in g, r, i and z, are selected for the stack
production;
The parent sample of images after the QualityFITS selections is composed of 1000 u*, 1059 g, 1728 r, 1064 i,
291 y and 1236 z-band images. 25% of the sample are short photometric or Pre-Wide exposures that are only
used for calibration but are not combined into stacks.
All stacks have the same pixel scale and cover exactly 1×1 deg2 (19354×19354 pixels of 0.1860"). The stacks
only combine images that are part of a CFHTLS Wide observing sequence and that are within 3 arcminutes of
the CFHTLS pre-defined stack center
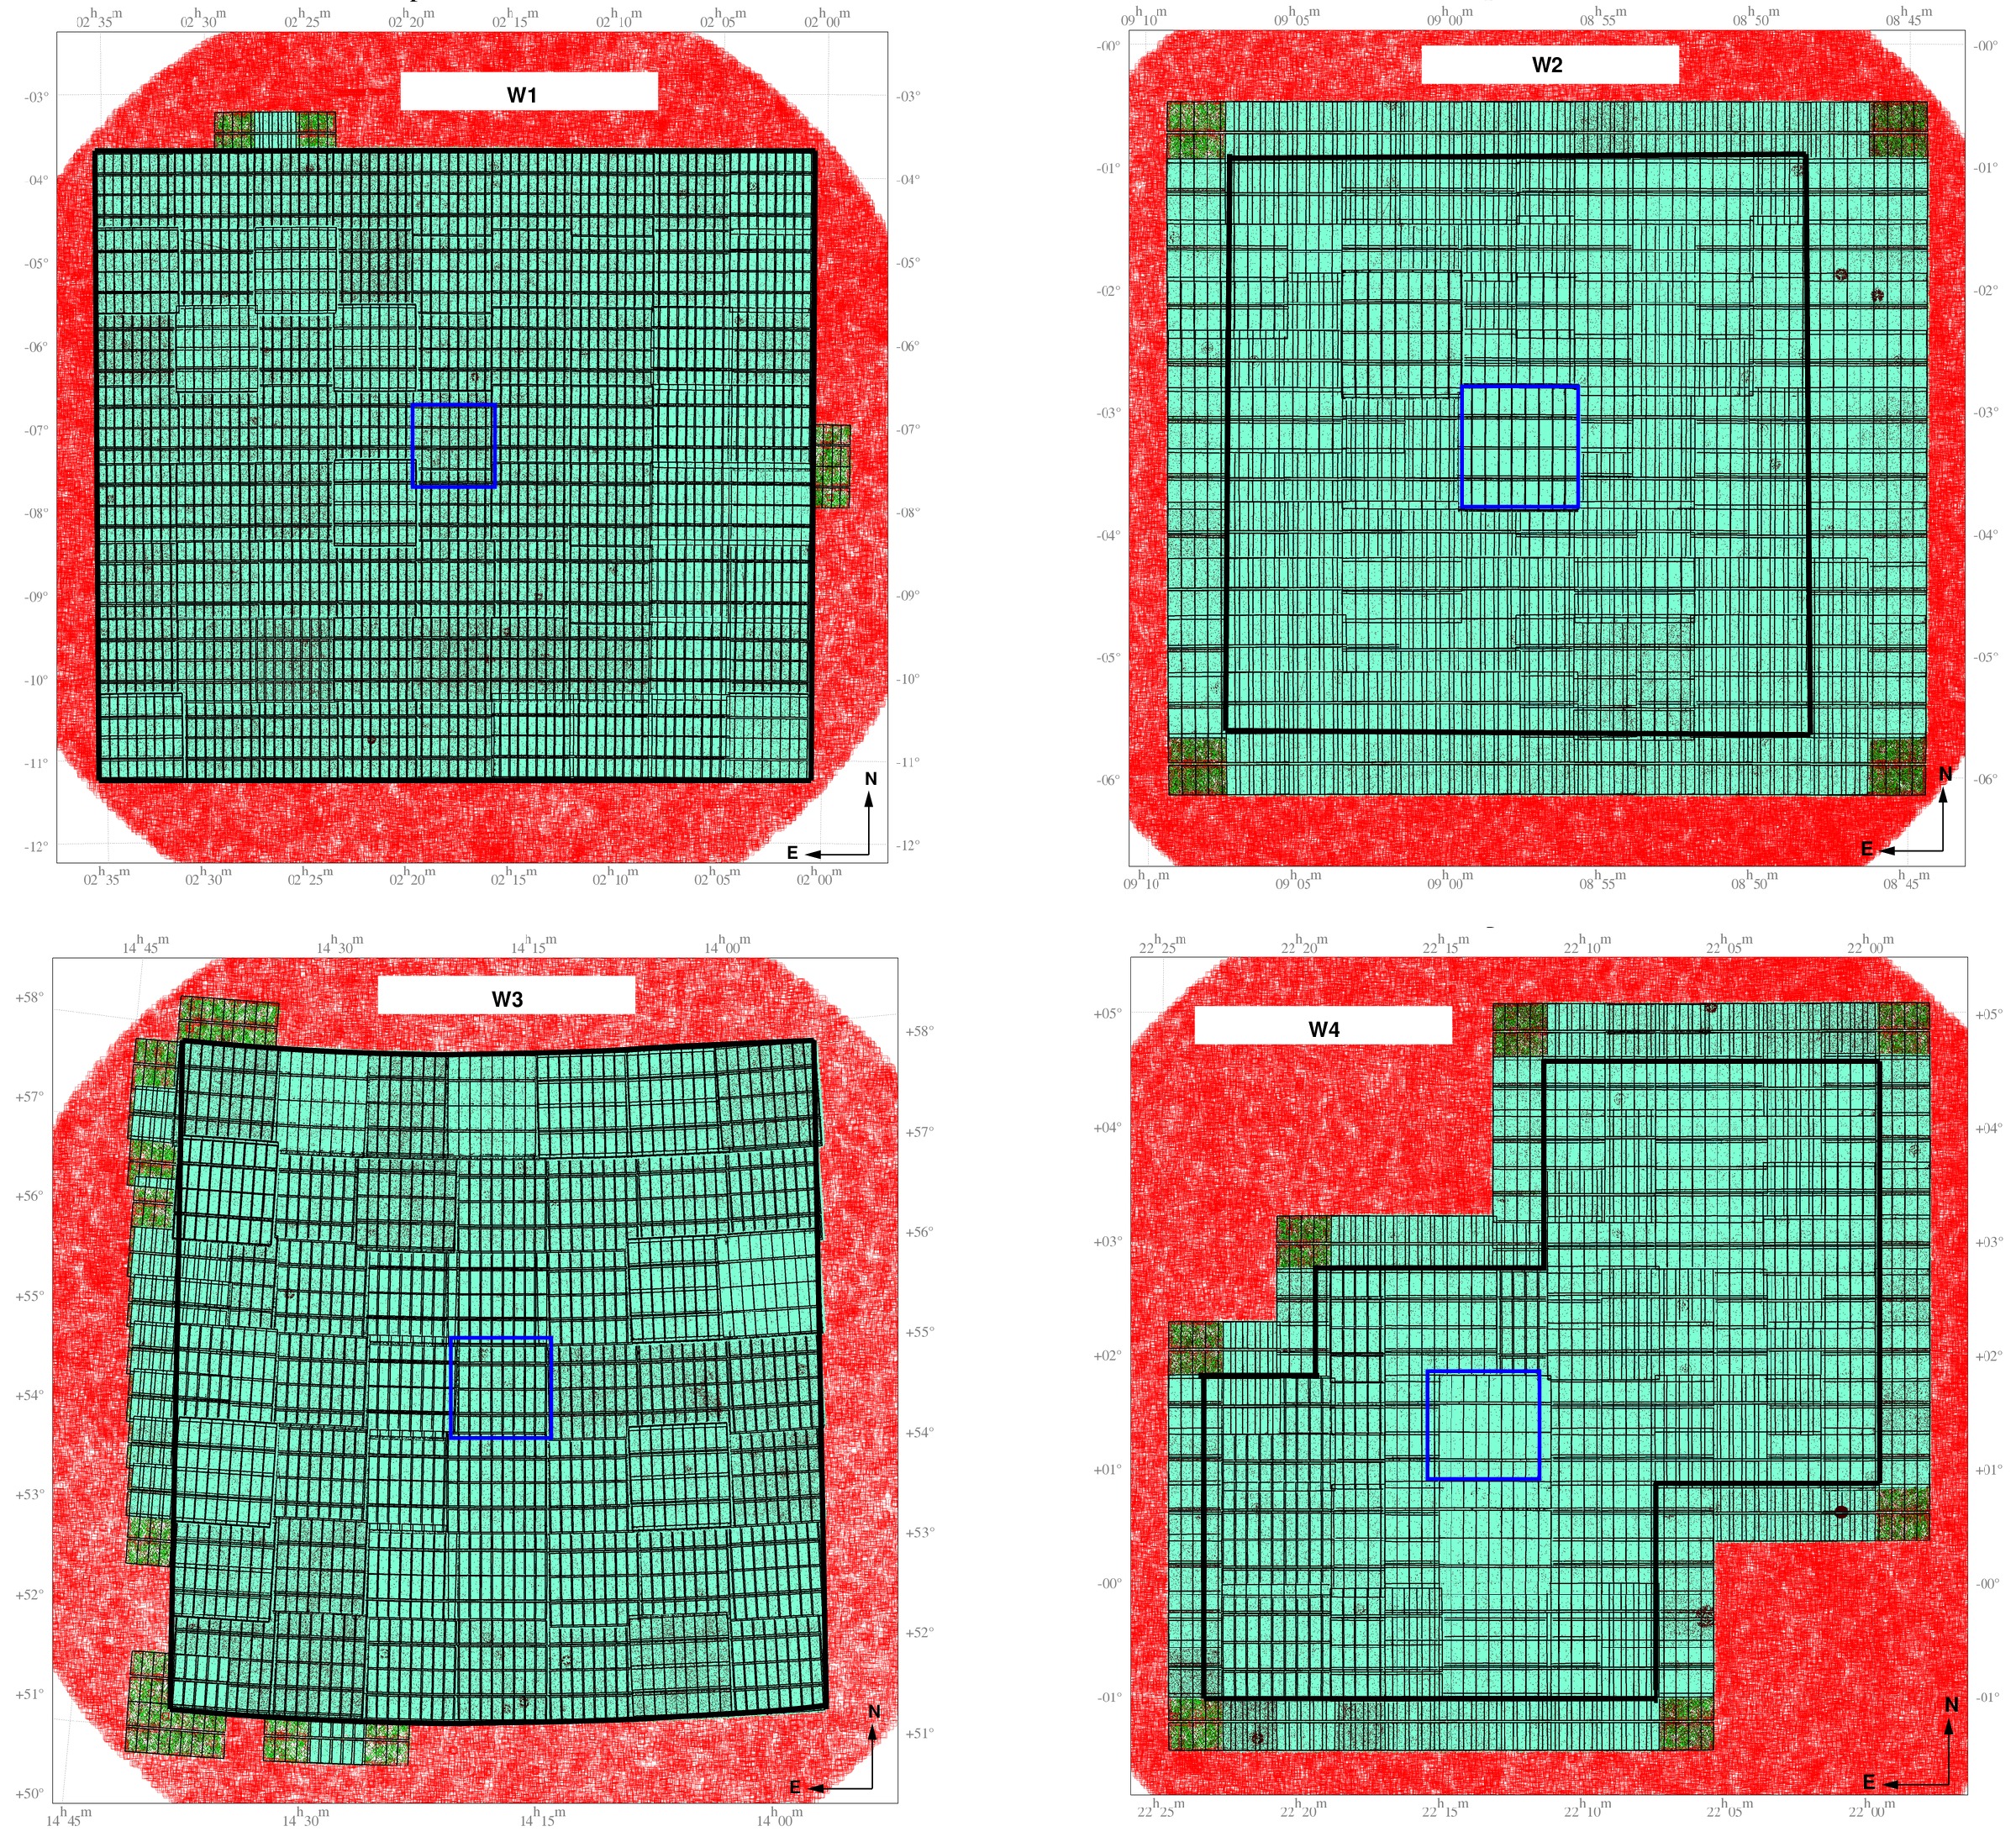
| Figure 19: | Positions and geometry of the CFHTLS Wide fields. The black thick contours show the total field
of view composing the u*,g,r,i∕y and z stacks of the T0007 release. The fields located outside these regions are
supplementary astrometric calibration data but are not included in the stacks. W1, W2, W3 and W4 do not cover
the same field of view, so the four Wide regions are not shown with the same scale in this figure. The blue squares
show a typical MegaCam field of view and indicate the positions of the reference center field. The MegaCam
images included in the release are in green. They reveal the tiling and mosaicing of each CFHTLS Wide area.
The small rectangles indicate individual MegaCam CCDs. These plots have been produced by SCAMP during the
calibration step of W1, W2, W3 and W4. |
|
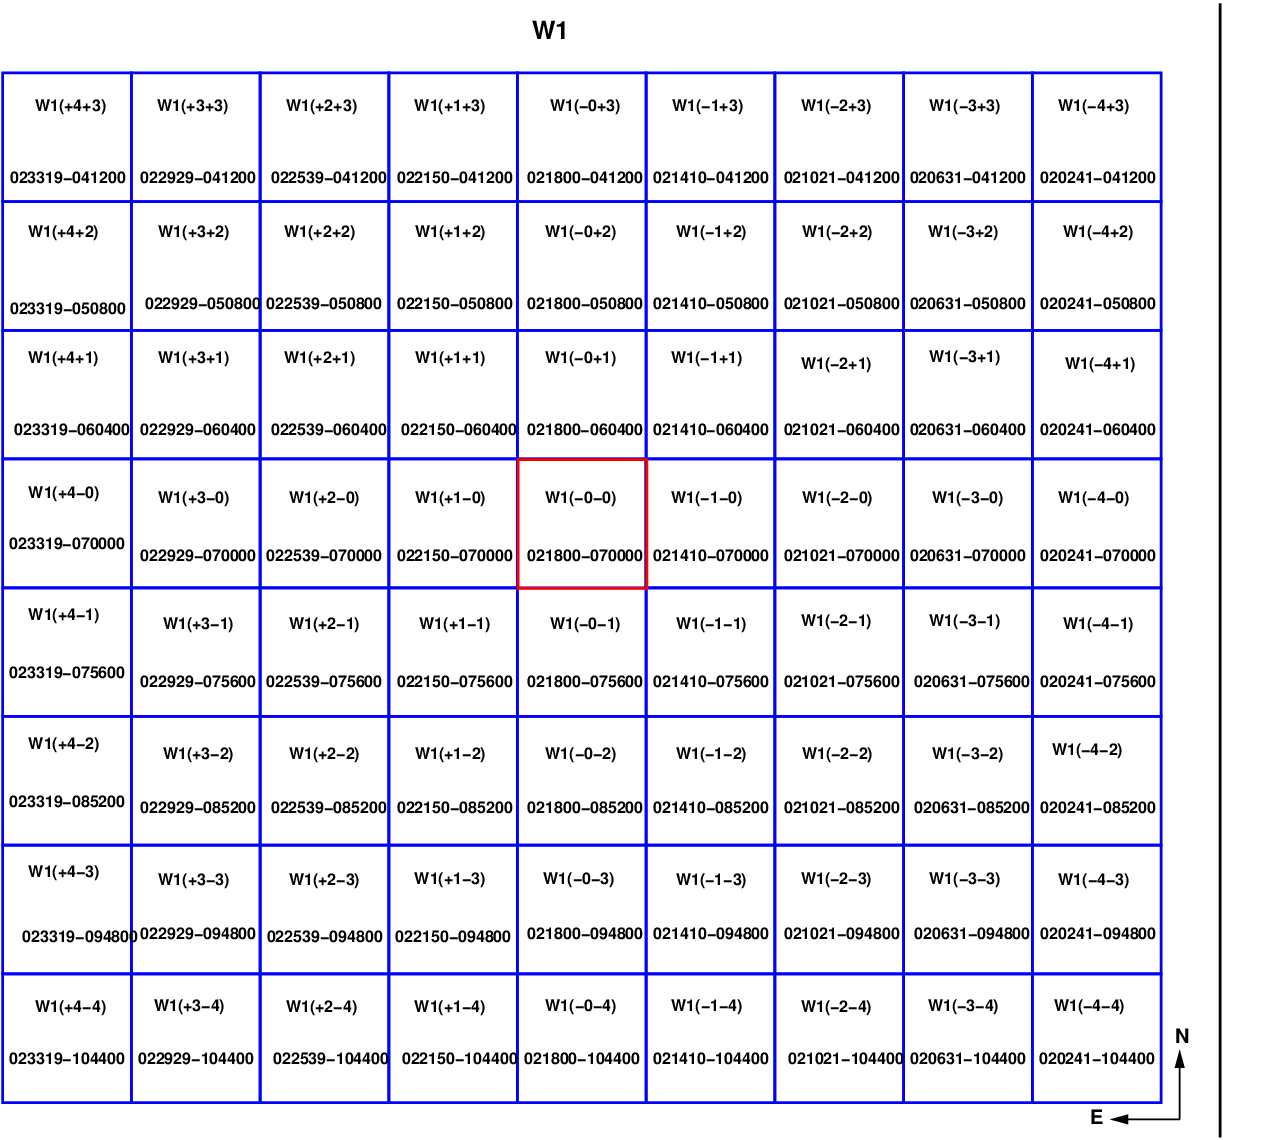
| Figure 20: | Positions, identification and naming conventions of stacks in the CFHTLS Wide survey.
The figure shows the positions of each “tile” (blue square corresponding to the field of view of
MegaCam) covering the W1 and W2 Wide fields. Each tile is labelled by its Cartesian name on
top (see cplt/oldSite/Descart/summarycfhtlswide.html) and the
official CFHTLS below. Field W*(0,0) (in red) at the approximate center field of each survey patch,
before the survey strategy changes. |
|
|
|
|
|
|
|
| | | | | | | | | | cfhtls | Reference center | Total | Total sky | Filters | Comment |
| field | ra | dec | pointings | coverage | | |
| name | [J2000] | [J2000] | [n×p] | [deg2] | | |
| | | | | | | |
|
|
|
|
|
|
| | | | | | | | |
| W1 | 02:18:00 | -07:00:00 | 9×8 | 8.5×7.5 | u*,g,r,i∕y,z | 16 y |
| W2 | 08:57:49 | -03:19:00 | 5×5 | 4.8×4.7 | u*,g,r,i∕y,z | New center; 2y |
| W3 | 14:17:54 | +54:30:31 | 7×7 | 6.7×6.6 | u*,g,r,i∕y,z | 7 y |
| W4 | 22:13:18 | +01:19:00 | 25 | 23.3 | u*,g,r,i∕y,z | se-nw elongated; 7 y |
| | | | | | |
|
|
|
|
|
|
| | |
| Table 3: | Overview of the CFHTLS Wide fields. The pointings “n×p” refer to the numbers of tiles along the
horizontal and vertical axes of MegaCam (i.e. the e-w and n-s axes). Sky coverage is expressed along ra and dec
axes. |
|
|
|
|
|
| | | | | | | | Filter | Median number | Median exposure time | Mean limiting magnitude | Mean image quality |
| | of exposures | [seconds] | [MegaCam AB system] | [′′] |
| | | | | |
|
|
|
|
| | | | | | |
| u* | 5 | 3000 | 25.2 | 0.85 |
| g | 5 | 2500 | 25.5 | 0.78 |
| r | 4 | 2000 | 25.0 | 0.71 |
| i∕y | 7 | 4300 | 24.8 | 0.64 |
| z | 6 | 3600 | 23.9 | 0.68 |
| | | | | |
|
|
|
|
| | |
| Table 4: | Mean properties of the CFHTLS Wide survey. The i and y are not split into two sub-samples. The Mean
limiting magnitude corresponds to the 80% completeness limit for point-like sources. The Mean image quality is
the mean FWHM of stellar sources over all stacks. |
|
Each stack comprises a sequence of medium exposures a few hundred seconds long each. After each exposure
the telescope is shifted by a small amount (typically a few tens of arcseconds, see the right panel of Fig. 21) in
order to fill the gaps between CCDs and enable the rejection of bad pixels and cosmic rays during subsequent
processing steps.
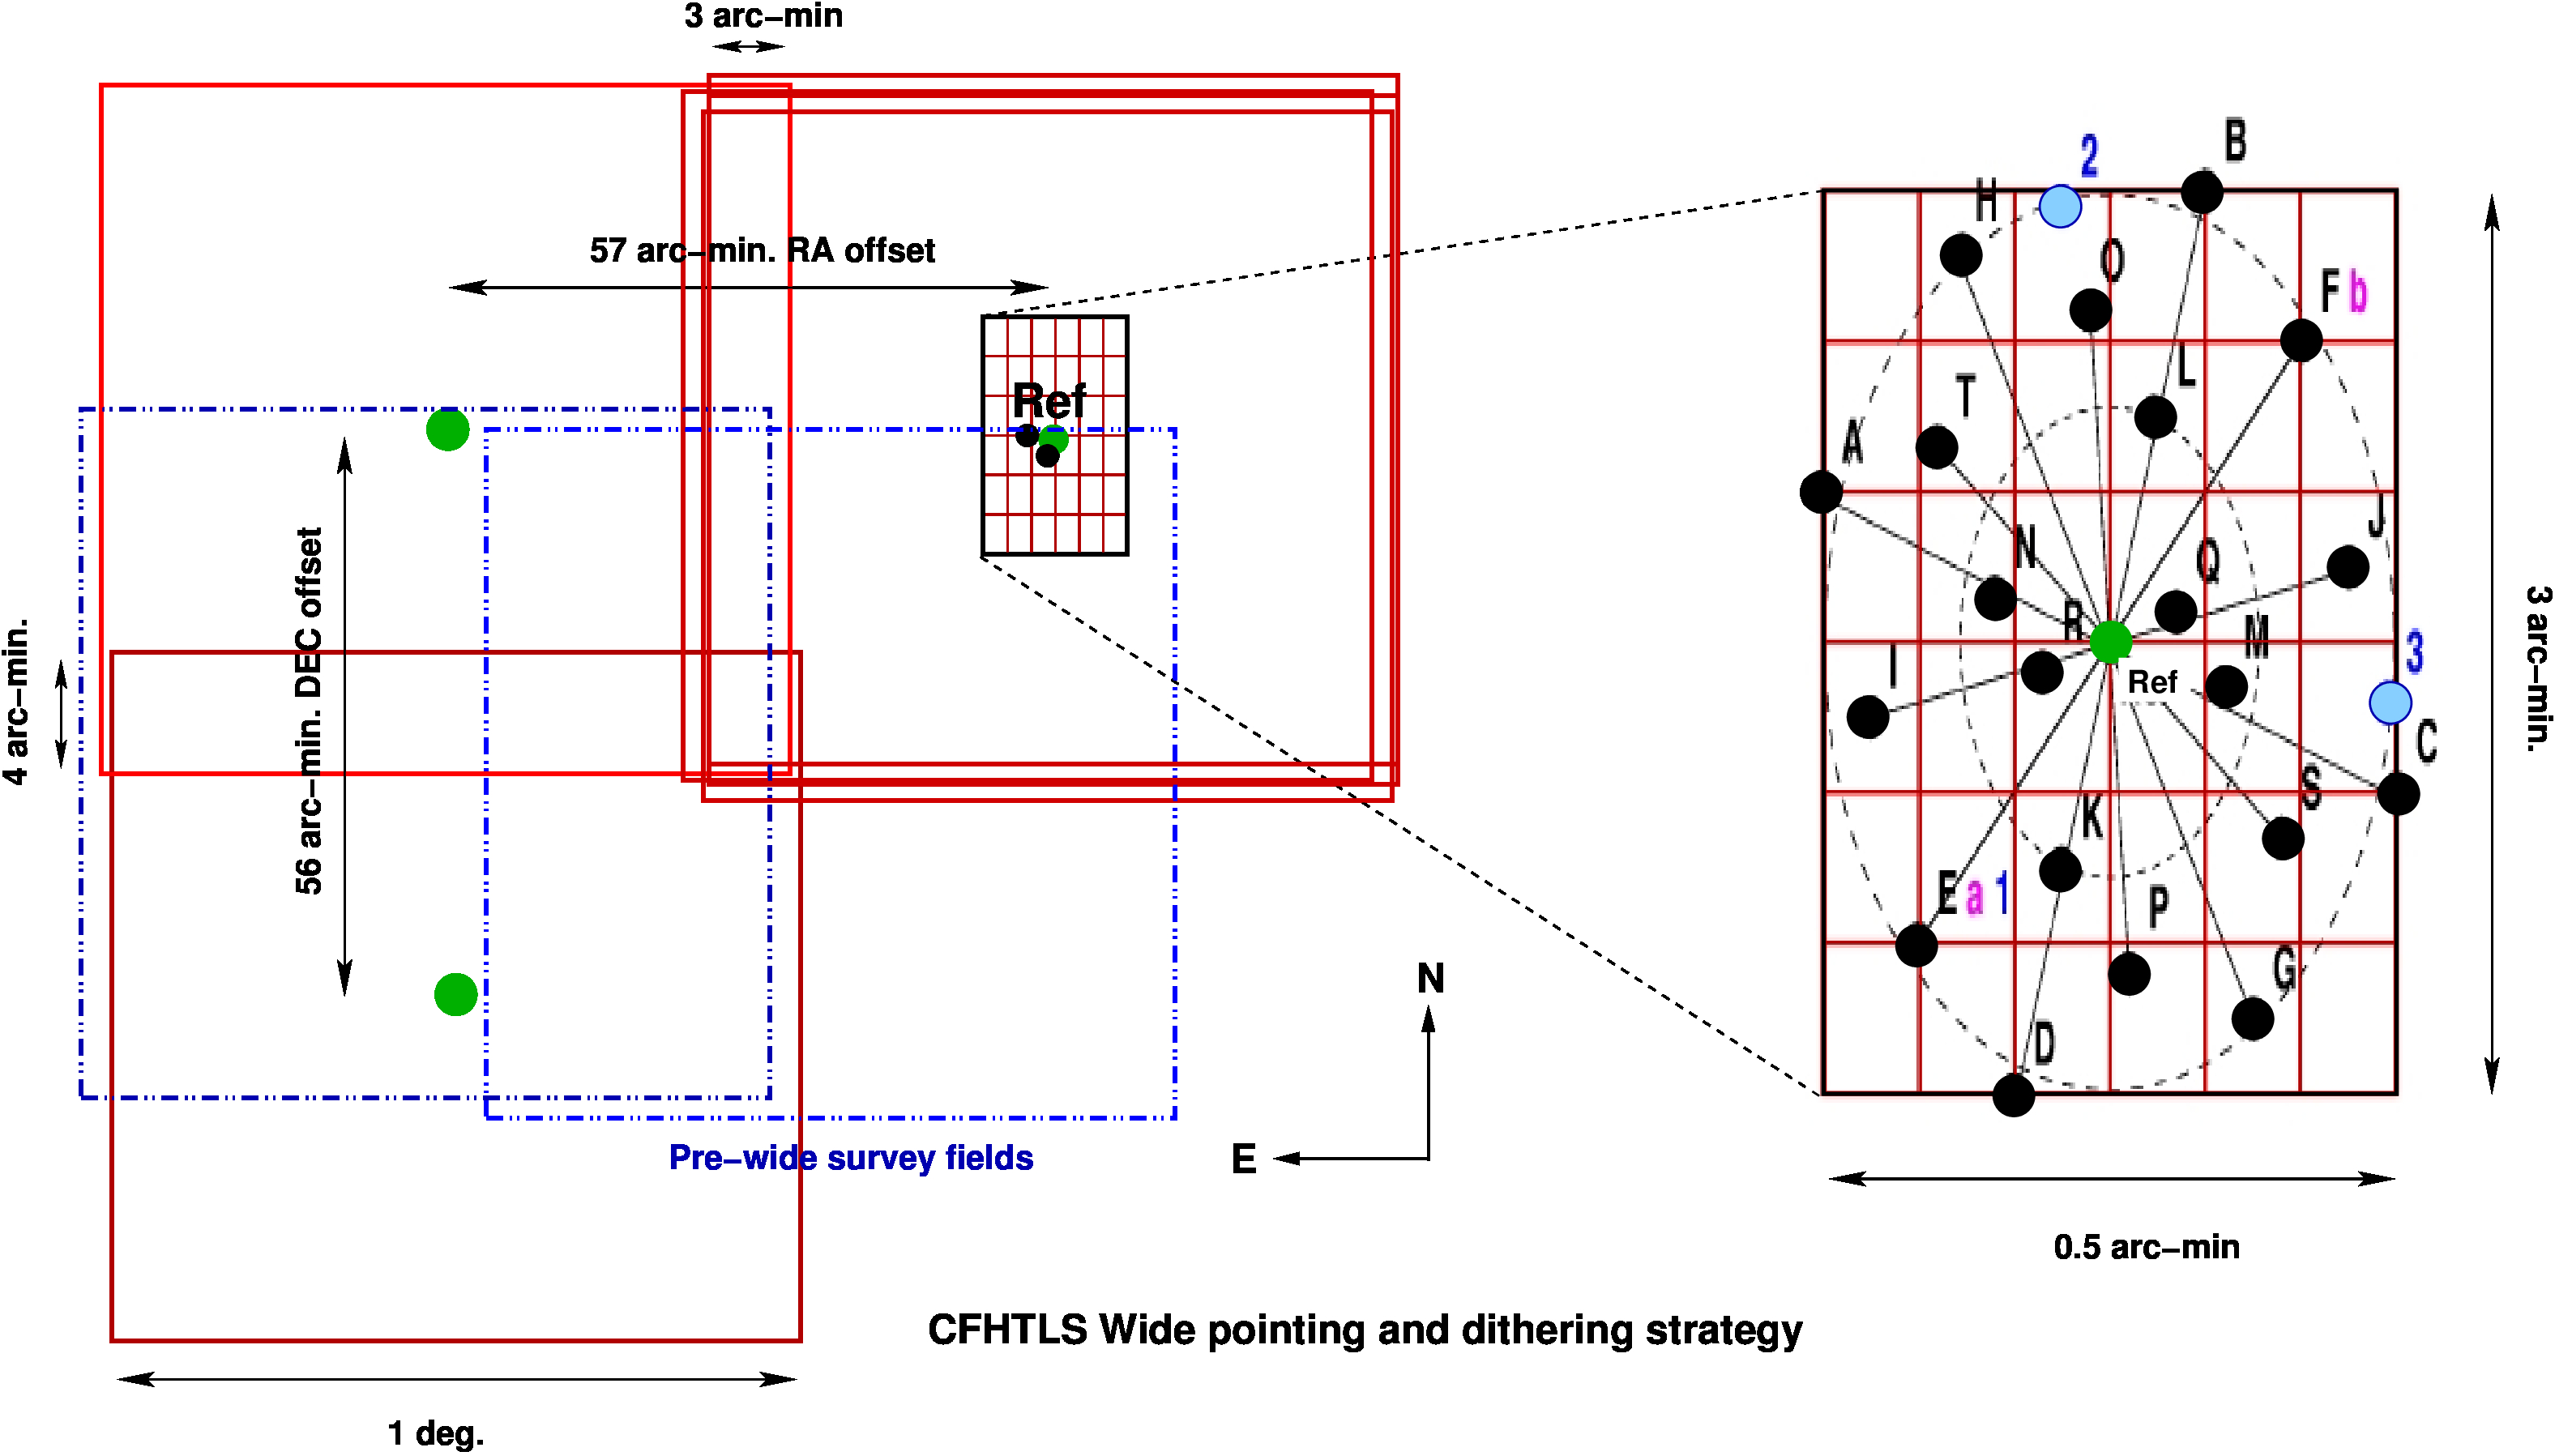
The adjacent fields have an overlapping region of several arcminutes width to constrain the field-to-field
astrometric and photometric calibrations. The size of the overlaps is 4 arcmin in DEC and 3 arcmin in RA (see
Fig. 21). The overlaps between fields reduce the sky coverage of the 171 CFHTLS Wide tiles to approximately
155 deg2.
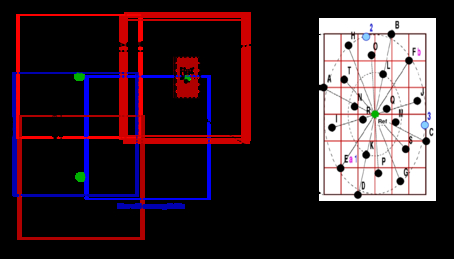
| Figure 21: | Offsets between adjacent pointings (left) and dithering (right) inside a pointing of the CFHTLS Wide survey. Each pointing (or tile) overlaps along
the ra and dec directions with its nearest neighbors. In addition to the large offsets, the observations at each CFHT Wide reference position ("Ref" and green
filled circles) are split into an observing sequence of exposures, with a small dither between each. The dithering pattern depends on the number of exposure per
sequence and is different for each filter (see Table 4). In all configurations the dithered positions (black filled circles) are among those located inside a 30"×180"
ellipse centered at the reference position of a Wide pointing. This is illustrated on the right hand of the figure (drawn from the CFHT dithering pattern plot:
http://www.cfht.hawaii.edu/Instruments/Imaging/MegaPrime/specsinformation.html. The details of this figure are given at this URL). The offsets
and the dithers along the DEC direction are sufficiently large to fill the central horizontal gap (83′′high) between the CCDs (see Fig. 2) with a fraction of exposures
of each sequence. The dash-dot-dot blue squares on the left show the positions of Pre-Wide images. They are shifted by a half-MegaCam field of view, in both
directions, in order to provide very large overlaps between pointings and ease the astrometric calibration. The Pre-Wide images are short exposures (3 mn) only done
in r-band. |
|
Each tile is centered at a well-defined position. The coordinates of a stack center position are identical for all
filters. W1, W2, W3 and W4 are therefore composed of a complete set of u*,g,r,i,y and z adjacent square tiles
of 1 deg2 each.
The integer part of the center position of each tile is used to name the final stacks and other data products. This
naming convention was agreed by CADC, Terapix and the CFHTLS Steering Group and is valid for all CFHTLS
releases.
In addition to the official astronomical CFHTLS naming convention, Terapix defined in 2002 a
shorter naming convention based on a Cartesian grid coordinate system, where the increment unit is
a MegaCam-size field and the center positions of the grid points are the center positions of the
tiles .
The reference center of each Wide field of view is defined as the reference W![[1,2,3,4]](T0007-doc19x.png) (0,0) and the Cartesian
field names increase toward the East and North. The tiling and field naming conventions are drawn on Fig. 20
and the complete list of the T0007 Wide stacks is given in Tables 30.
(0,0) and the Cartesian
field names increase toward the East and North. The tiling and field naming conventions are drawn on Fig. 20
and the complete list of the T0007 Wide stacks is given in Tables 30.
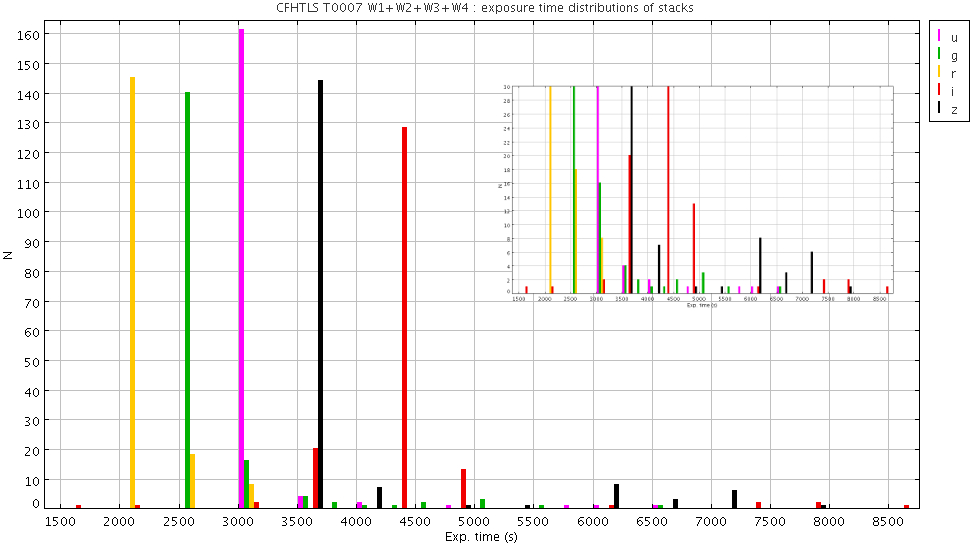
The total exposure time per filter is approximately the same for each tile (see Table 30 and the synoptic table).
For some tiles, the exposure time is longer than the nominal value, because exposures that were considered
out of spec by QSO and hence immediately reobserved have been later on salvaged at the post
processing time. It produces very sharp exposure time distributions for all filters (see Fig. 23). Some
observations have been adjusted to take into account unexpected events (like absorption by clouds/cirrus or
technical problems). There are a few fields that have deeper u*-band and z-band exposures which
explains the small tails shown in the inset of Fig. 23. These longer exposures were taken before it
was decided to cut the u* and z exposure times by a factor of two at the survey mid-term review
(2005).
In addition to the original CFHTLS exposures, the VIPERS consortium took complementary exposures to fill in
the holes in W1 which were caused by malfunctioning CCDs later in 2003. These images (distributed in 6
pointings and three filters u,g and y) have been added to T0007. As a result, these pointing are deeper than the
rest of the survey. A detailed description of the added VIPERS-DDT images can be found in Table 5. Their
position on the W1 patch are shown in Figure 22.
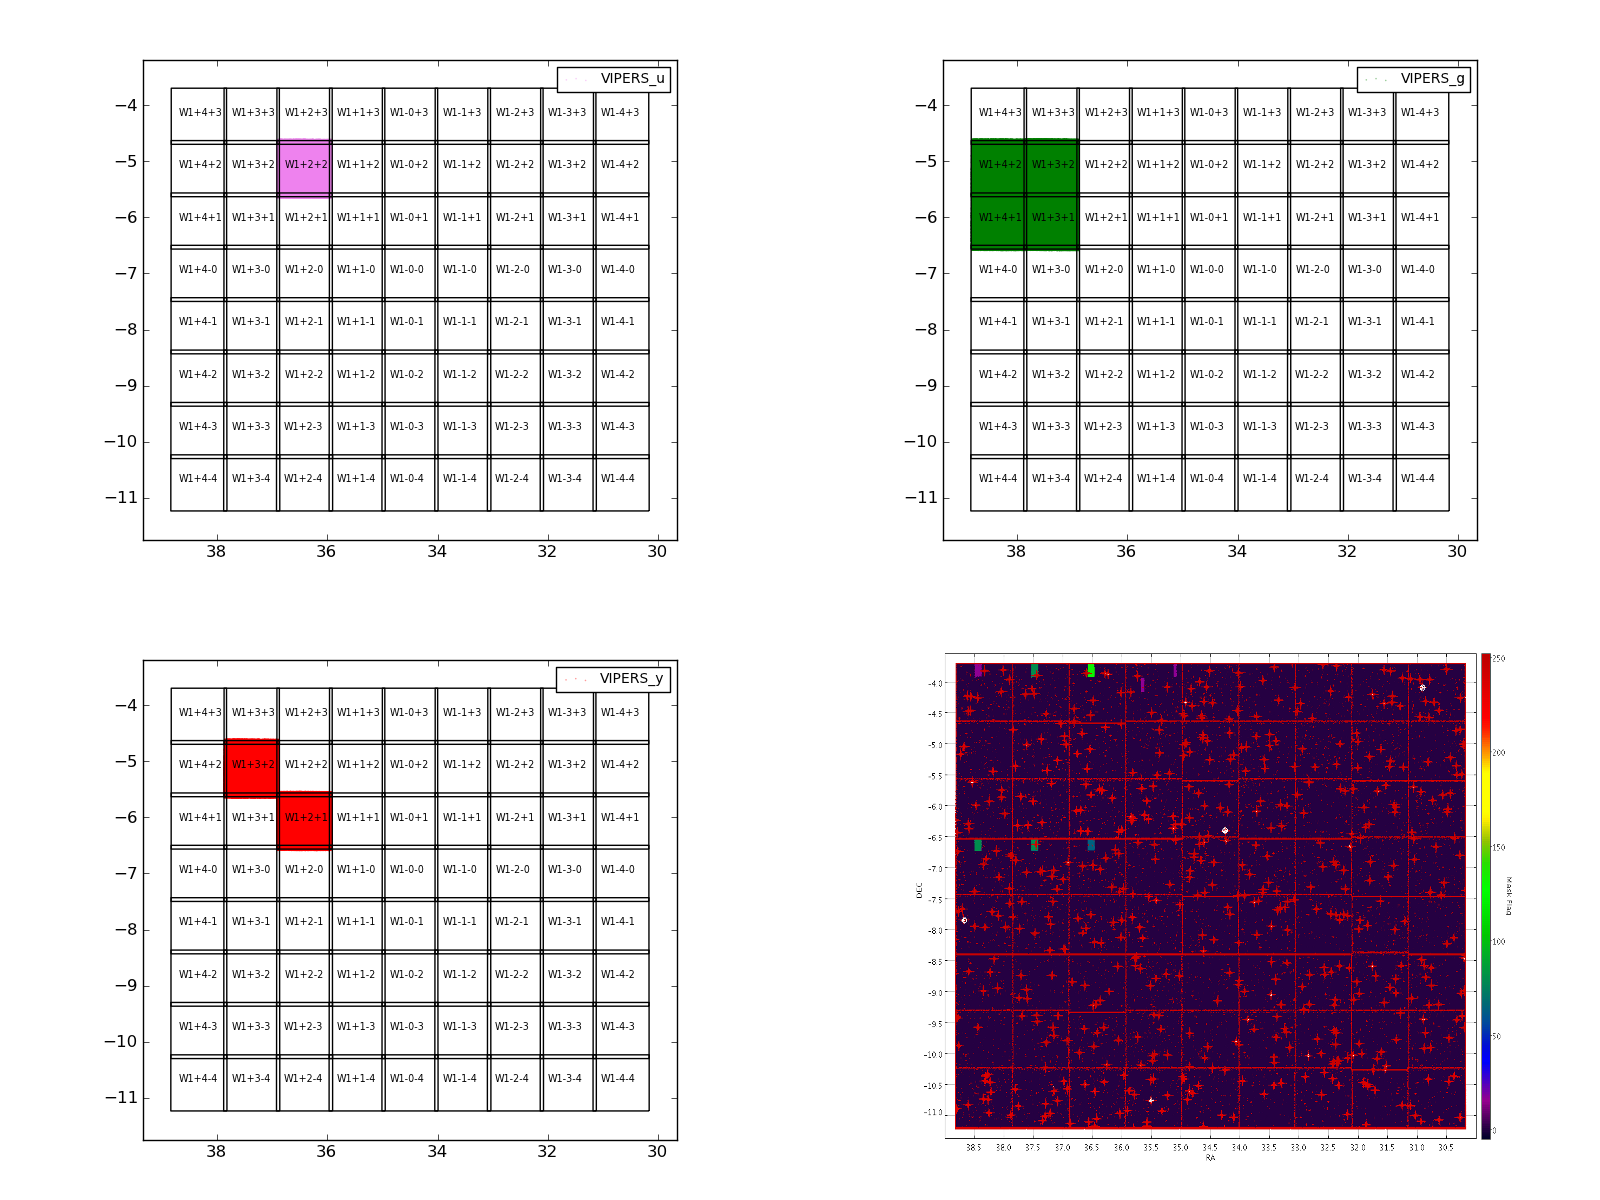
| Figure 22: | Position of the additional VIPERS-DDT exposures used to fill in the holes in the survey.
Top left: u*-band, top-right: g-band, lower left: y-band. lower-right: filter mask coverage of the W1 Wide
patch (See Section 6 for the meaning of the flags). Seven fields still remain with half-CCD holes in
one or more filters due to the malfunctioning of some CCDs late 2003. These anomalies are listed in
Tables 14 and 15. |
|
|
|
|
| | | | | | | Wide position | Filter | Exposure time (per image) | Number of exposures |
| | | [s] | |
| | | | |
|
|
|
| | | | | |
| W1+2+2 | u.MP9301 | 600 | 6 | | | | | |
| W1+4+2 | g.MP9401 | 290 | 7 |
| W1+3+1 | g.MP9401 | 290 | 5 |
| W1+3+1 | g.MP9401 | 290 | 5 |
| W1+4+1 | g.MP9401 | 290 | 5 |
| | | | |
| W1+2+1 | i.MP9702 | 300.096 | 7 |
| W1+3+2 | i.MP9702 | 300.092 | 5 |
| | | | |
|
|
|
| | |
| Table 5: | Description of the 40 additional VIPERS-DDT images. |
|
All r-band stacks combine data taken during two epochs separated by at least two years and totalling 2×500 s
each. In all filters except u*, observations were carried out only when the seeing (FHWM) was below 0.95". For
the u*-band, this rule was relaxed to 1.3".
The complete list of CFHTLS input images that were combined into the Wide stacks is given in the Appendix
A.2, in Table 31.
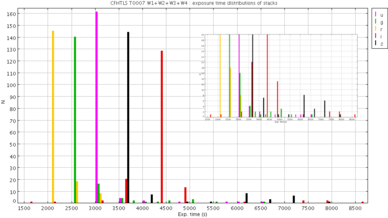
| Figure 23: | Distribution of exposure times over the Wide fields. The inset is a close-up view of the long
exposure tails. |
|
The global properties of the CFHTLS Wide survey are summarized in Table 4 and in more detail in Table ??.
Overall, they meet the survey specifications but the homogeneity of the survey over a Wide patch scale must be
assessed carefully. The Wide field-to-field and MegaCam tile-to-tile scatters will be explored in detail in the
following sections. The depth, the seeing, the photometric errors analysis are presented in the next parts of the
document.
Finally, the complete set of configuration files used for the T0007 release is presented in the Appendix. They are
intended for users who would prefer to re-process the pre-processed or the stacked images with
parameters tuned for their own scientific projects. The configuration files are available on request from
Terapix.
|
|
|
|
|
|
|
|
| | Field | Parameter | u* | g | r | i | y | z | ugriz coverage |
|
|
|
|
|
|
|
|
| | | | | | | | | | | | W1 | Nb stacks | 72 | 72 | 72 | 56 | 16 | 72 | 72 |
| | Raw observed area | - | - | - | - | - | - | 64.16 | | | Final unmasked area | 58.47 (210500) | 58.41 (210267) | 58.49 (210581) | 45.41 (163490) | 13.08 (47096) | 58.47 (210504) | 58.33 (209975) |
| | | | | | | | | | | W2 | Nb stacks | 25 | 25 | 25 | 23 | 2 | 25 | 25 |
| | Raw observed area | - | - | - | - | - | - | 22.22 | | | Final unmasked area | 18.60 (66952) | 18.51 (66624) | 18.60 (66952) | 17.19 (61878) | 1.43 (5152) | 18.60 (66952) | 18.50 (66622) |
| | | | | | | | | | | W3 | Nb stacks | 49 | 49 | 49 | 42 | 7 | 42 | 49 |
| | Raw observed area | - | - | - | - | - | - | 41.91 |
| | Final unmasked area | 37.04 (133351) | 37.04 (133351) | 37.04 (133351) | 31.74 (114277) | 5.56 (20018) | 37.04 (133351) | 37.04 (133340) |
| | | | | | | | | |
| W4 | Nb stacks | 25 | 25 | 25 | 18 | 7 | 25 | 25 |
| | Raw observed area | - | - | - | - | - | - | 22.09 |
| | Final unmasked area | 19.66 (70777) | 19.66 (70777) | 19.66 (70777) | 14.10 (50754) | 5.62 (20218) | 19.66 (70777) | 18.50 (66622) |
| | | | | | | | | |
| Wide | Nb stacks | 171 | 171 | 171 | 129 | 32 | 171 | 25 |
| | Raw observed area | - | - | - | - | - | - | 22.09 |
| | Final unmasked area | 133,77 (481580) | 133.616 (481019) | 133.795 (481661) | 108.44 (390399) | 25.69 (92484) | 133.78 (481584) | 132.38 (476559) |
| | | | | | | | | |
|
|
|
|
|
|
|
|
| | |
| Table 6: | The raw observed area is the surface covered by MegaCam the sky. The Final unmasked area is the
surface observed by the CFHTLS which is not masked (due to foreground star and instrumental defects). The
surface is given in square degrees and square arcminutes. |
|