4.2 Seeing and image quality
All seeing values reported in this document and in tables are computed using PSFEx (?). The seeing is
measured from a two-dimensional Moffat model of the PSFm and the FWHM is defined from the
ellipticity parameters of the PSF as FHWM= , where a and b are the size of the major and
minor axes derived from the model. For single CFHTLS input images, the seeing is sampled over a
CCD (~ 7′× 14′, see Fig. 24), and for T0007 stacks it is sampled over a 5′× 5′ grid. (Note that in
T0006 and anterior releases, the seeing was measured from the radius enclosing half the object
flux.)
, where a and b are the size of the major and
minor axes derived from the model. For single CFHTLS input images, the seeing is sampled over a
CCD (~ 7′× 14′, see Fig. 24), and for T0007 stacks it is sampled over a 5′× 5′ grid. (Note that in
T0006 and anterior releases, the seeing was measured from the radius enclosing half the object
flux.)
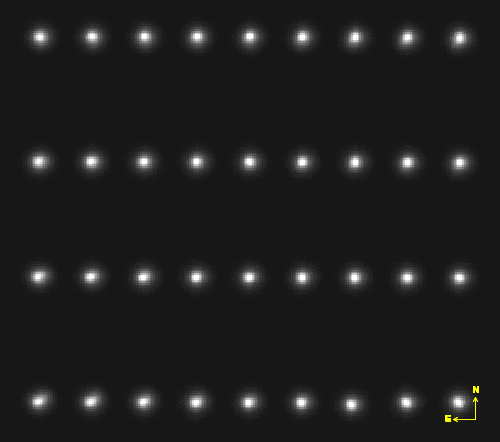
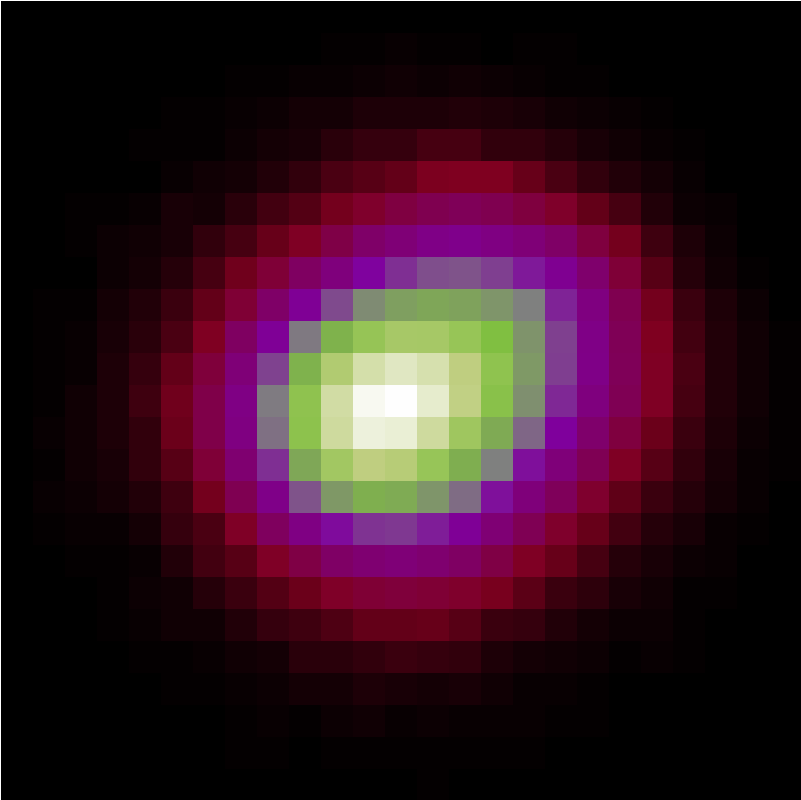 
| Figure 24: | (Top Left) Seeing (FWHM) mapped over the input i-band image 743065p.fits by
QualityFITS-in. This image was taken before the MegaPrime optics were optimized (fall 2004) to
deliver a uniform PSF across the entire field. It is used as an illustration of the image quality issue on
MegaCam from May 2003 to Nov. 2004. Each spot shows an image of the PSF computed by PSFex
from a model of stars detected on the CCD. The optical distortion of the wide field corrector is clearly
visible from PSF variation over the field. The median seeing over the MegaCam field is 0.692′′, but it is
0.642′′at the center, on CCD#22 (spot 23 from the top left corner), and 0.795′′at the bottom left corner.
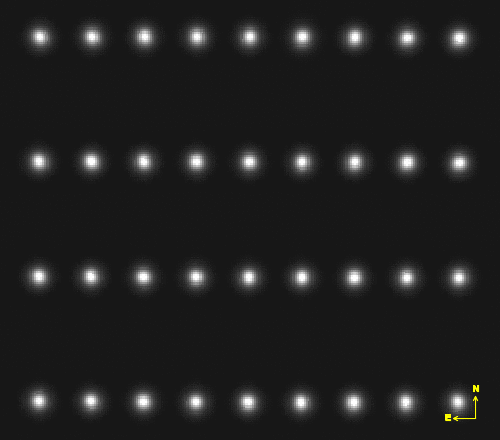
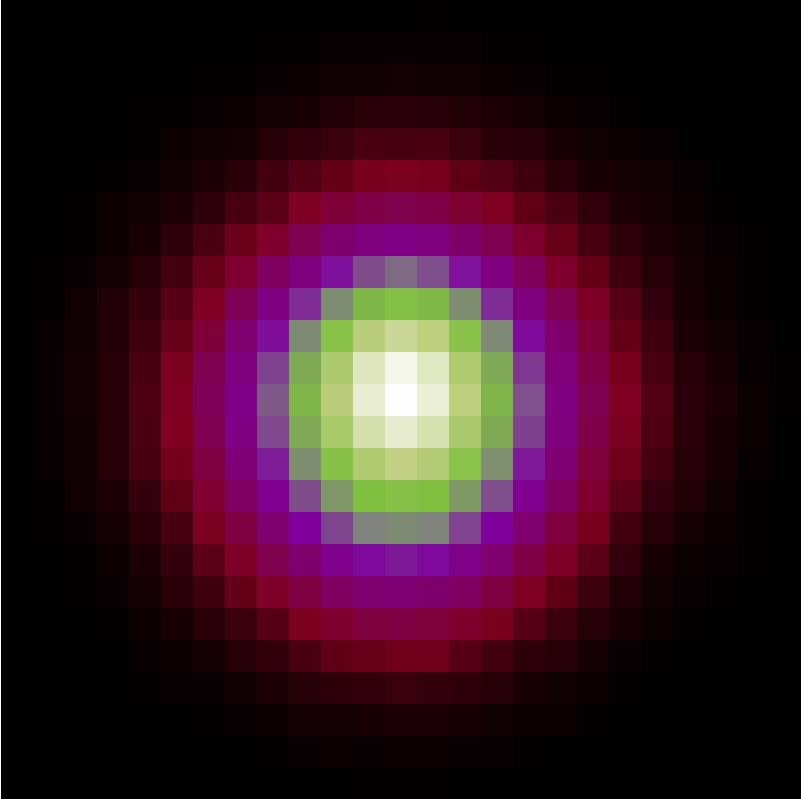
(Top Right) Seeing (FWHM) mapped over the input i-band image 980090p.fits by QualityFITS-in.
This second image was taken after the MegaPrime optics were optimised (fall 2004). The lower part
shows the clear improvement of the average PSF shape over the whole field: the tuning of the wide field
corrector reduced to less than 0.05′′the typical image quality degradation from the center to the edge of
the field. |
|
The PSF model of each stack (Wide and Deep) is determined using stellar sources selected by PSFex. All
unsaturated and sufficiently bright stellar sources identified over the entire MegaCam field are used. The median
seeing values of the survey are given in Table 4 and Table ??.
Overall, the CFHTLS Wide is within or better than expectations, thanks to the high ranking of
the program which meant most observations were made in good-seeing conditions (i.e. close to
median conditions at CFHT). The histograms drawn in Fig. 25 show the median seeing increases
from z to u*. However, more than 98% of g,r,i,y,z and more than 70% or u* band stacks have
seeing better than 0.9". Note that the histograms show the distributions of seeing over the whole
period of the survey. They merge together data obtained before and after the flip of the L3 lens
of the MegaPrime Wide Field Corrector (Dec. 4, 2004). This tuning produced an unexpected and
unexplained, but spectacular, improvement of the image quality and our merging of the pre-flip
and post-flip periods contribute to the large scatter of the seeing distributions. However, the Wide
survey had not made much observing progress by late 2004 compared to the SNLS/Deep survey
which remained a top priority within the CFHTLS, hence “contamination” by poorer image quality
images is quite minimal in the Wide survey. In consequence, despite this extra-scatter term, the image
quality of the CFHTLS Wide survey is excellent and unique compared to other current wide field
surveys.
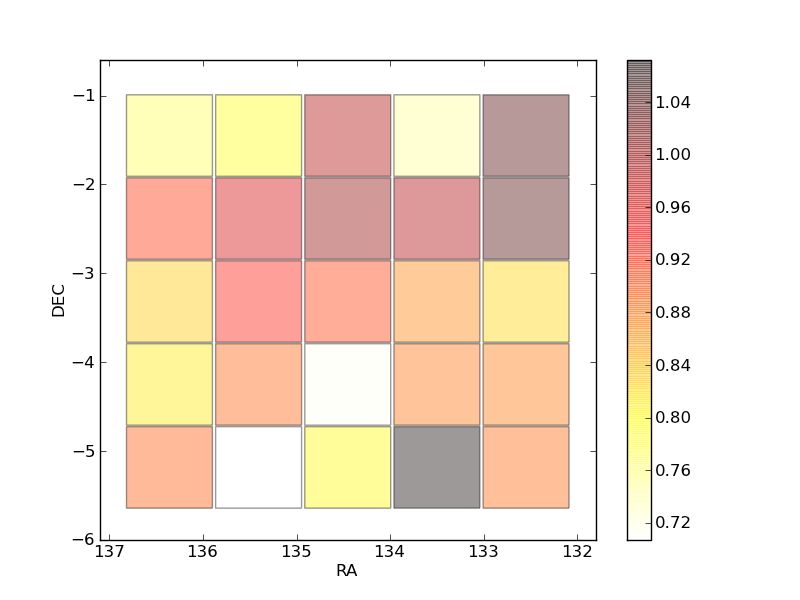
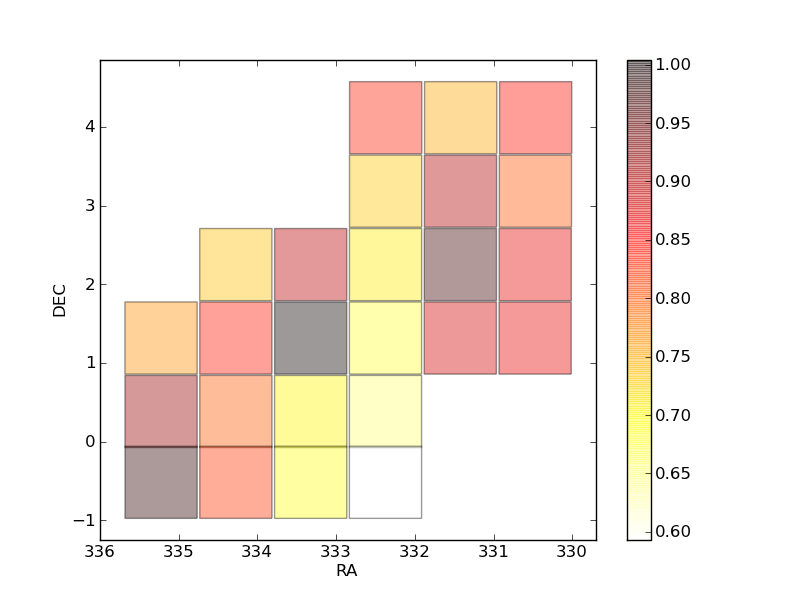
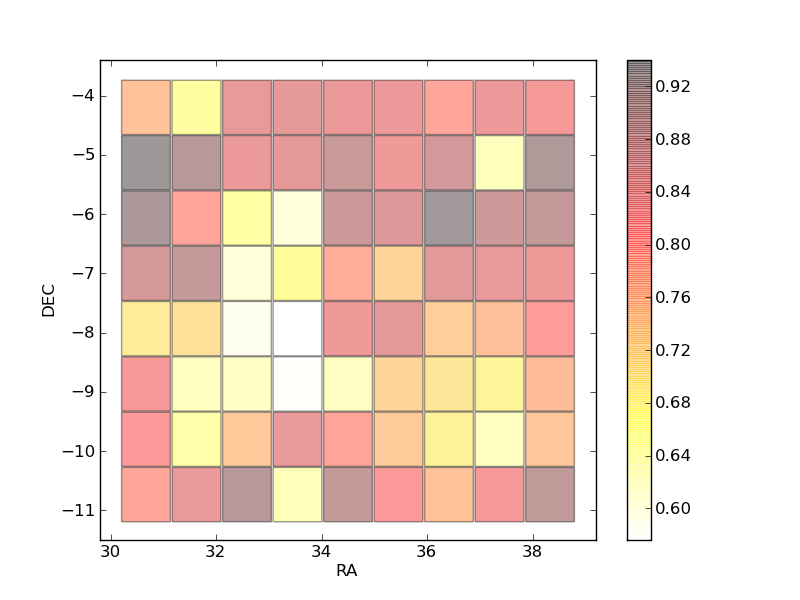
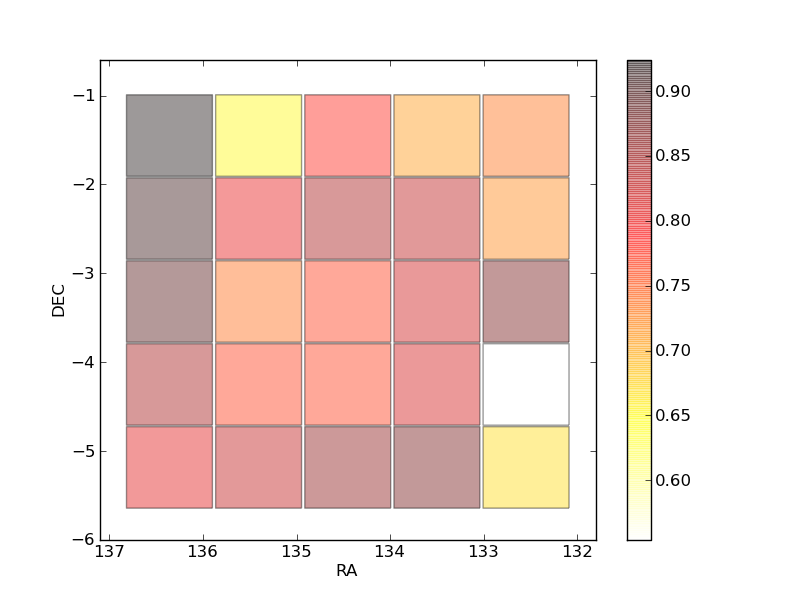
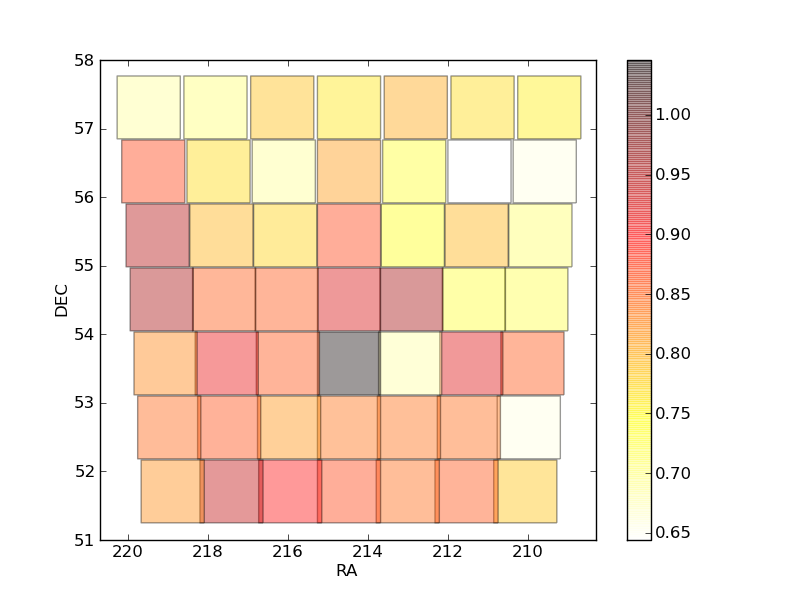
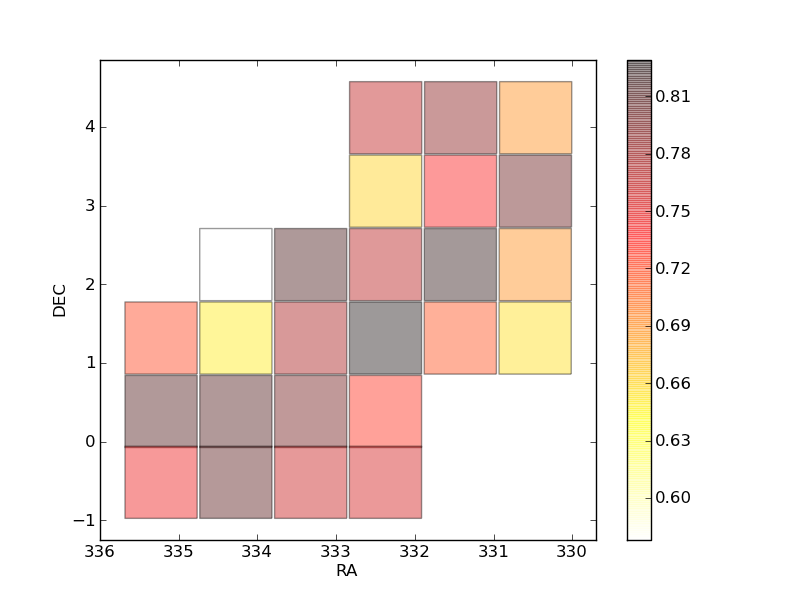
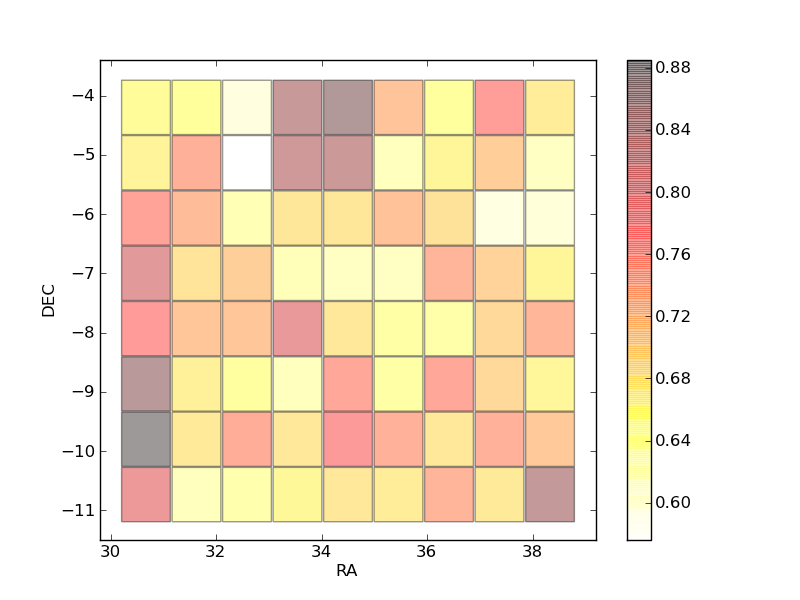
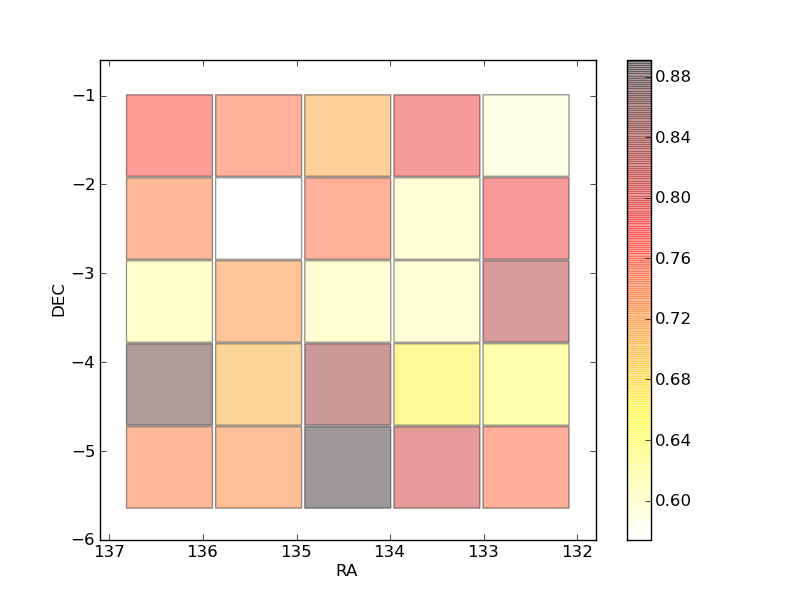
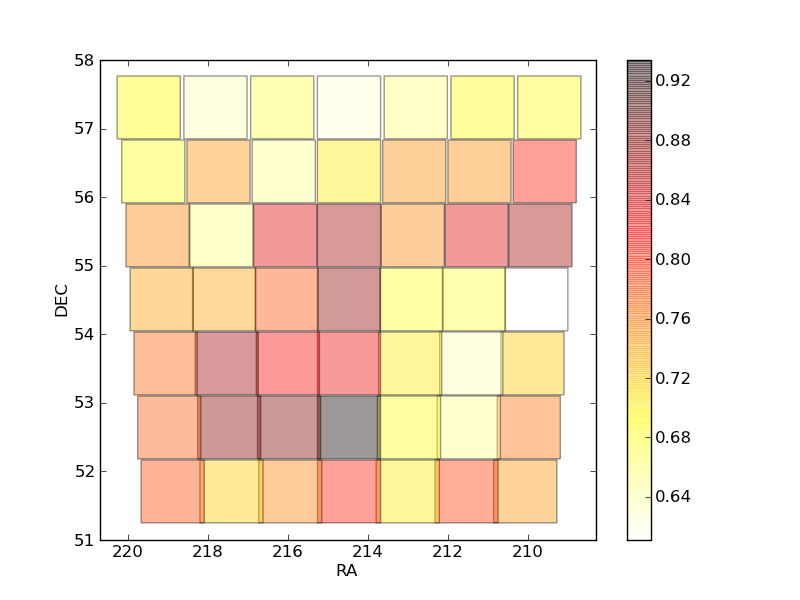
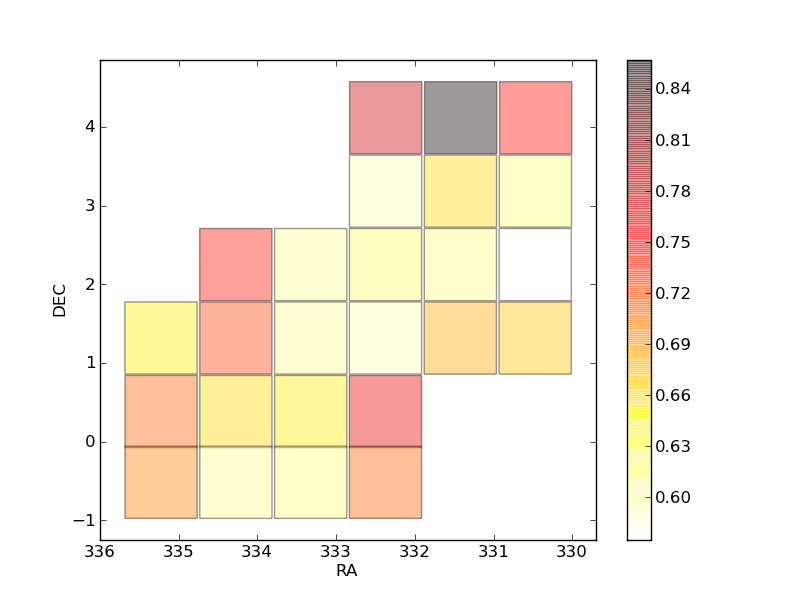
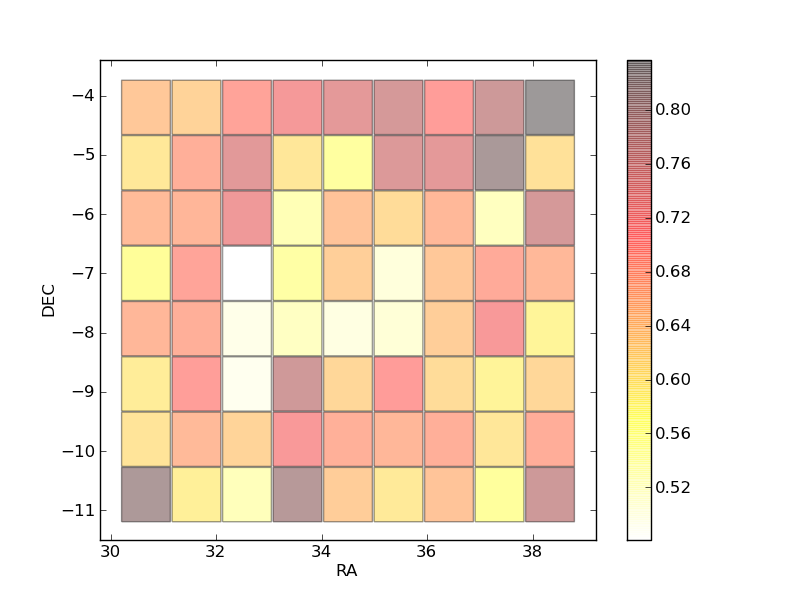
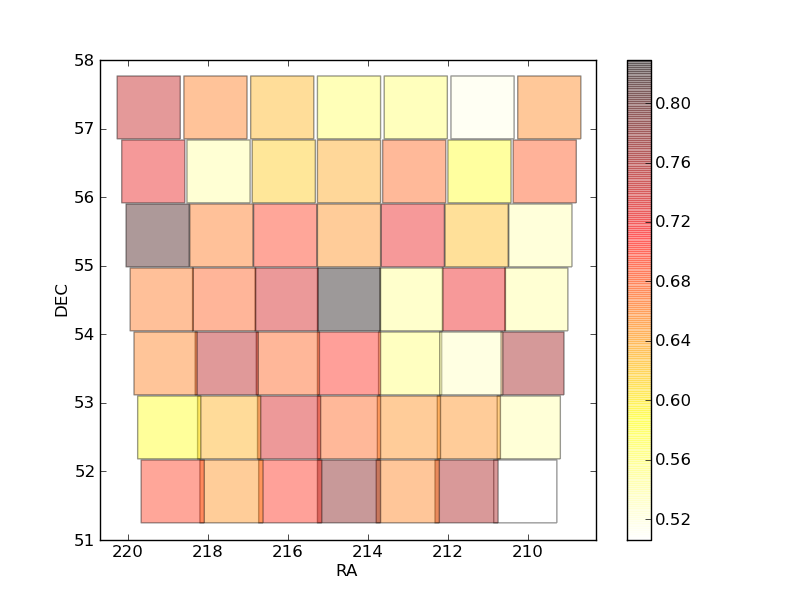
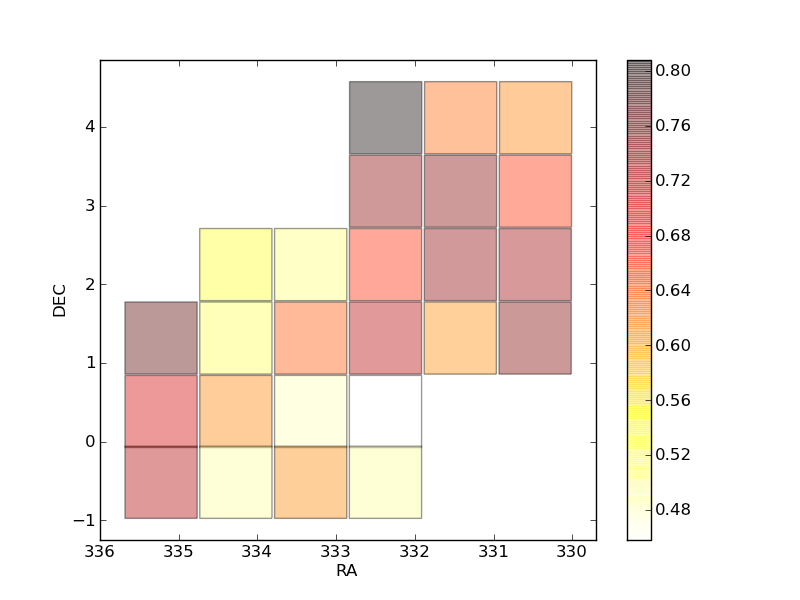
Figure 26 shows maps of the spatial distribution of seeings in all Wide stacks and for each filter. No
bias is observed, the median seeing of each stack appears randomly distributed over the four Wide
fields.
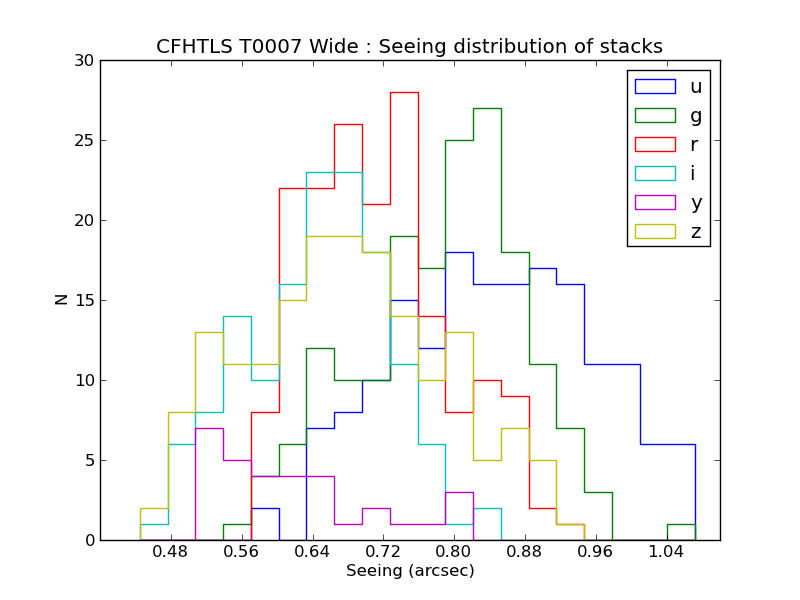
| Figure 25: | Distribution of the median seeing over the Wide tiles. The seeing is the FWHM= derived with
PSFEX, from the fitting of a 2-dimension Moffat model of the PSF. The mean seeing value over the MegaCam field
of each stack is available at cplt/T0007/table_syn_T0007.html. derived with
PSFEX, from the fitting of a 2-dimension Moffat model of the PSF. The mean seeing value over the MegaCam field
of each stack is available at cplt/T0007/table_syn_T0007.html. |
|
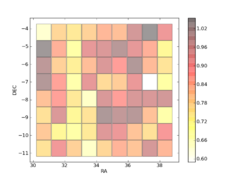 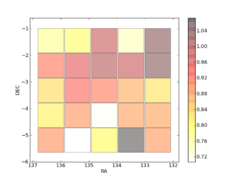 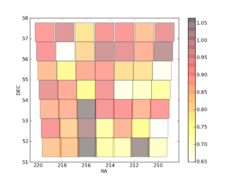 
 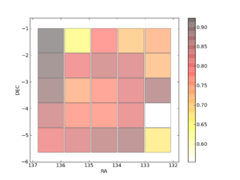 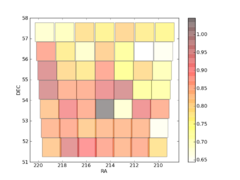 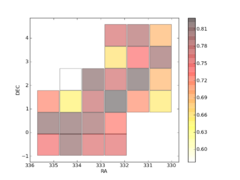
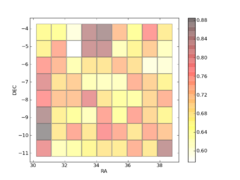  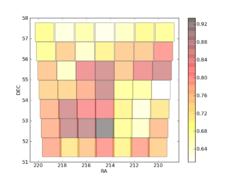 
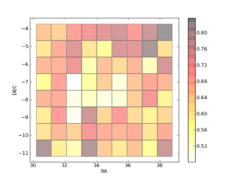 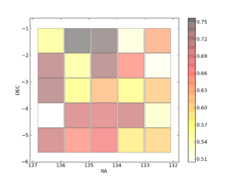  
 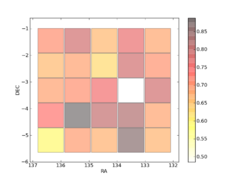  
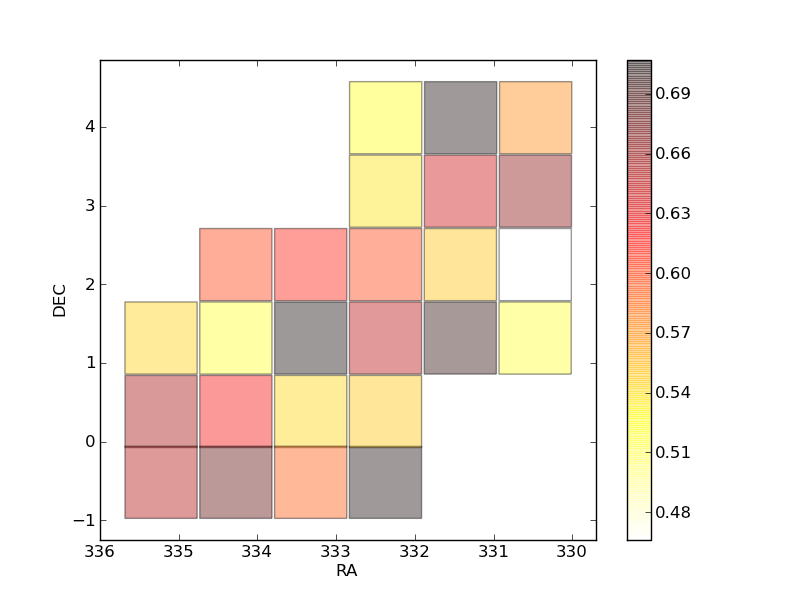
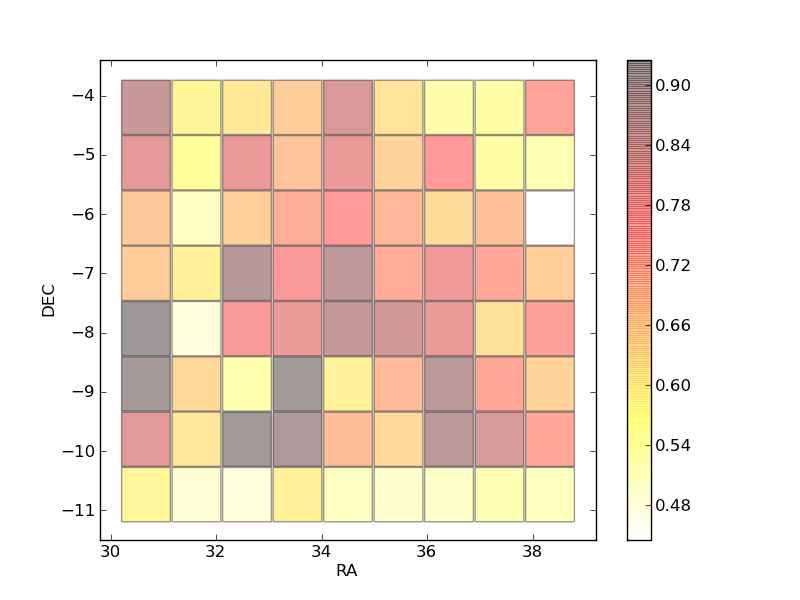
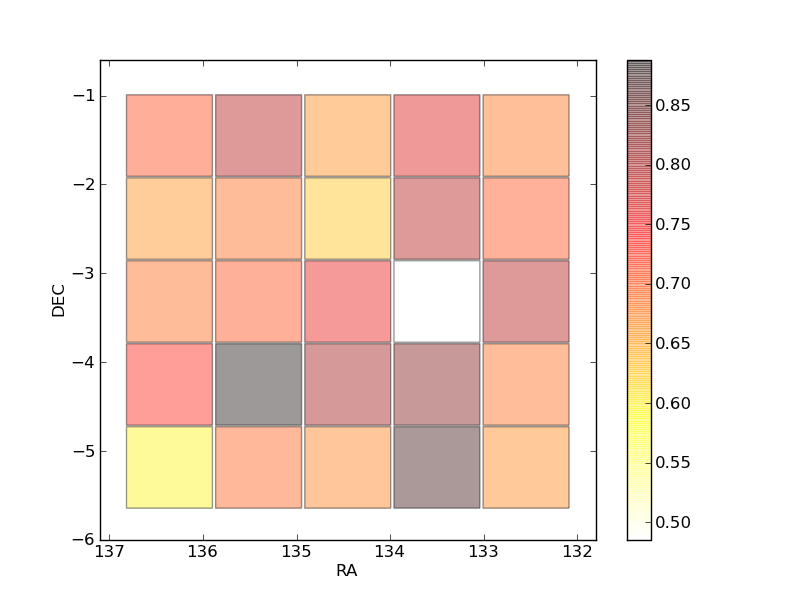
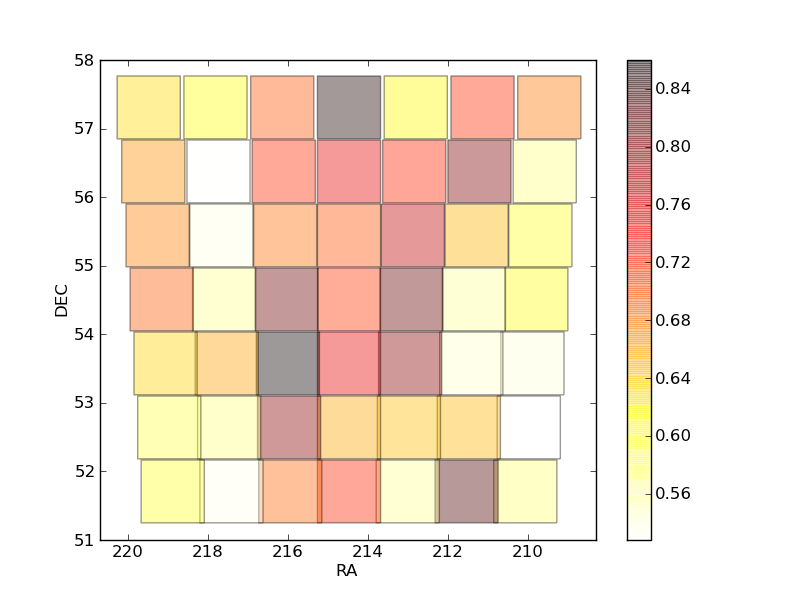
| Figure 26: | Maps of seeing (fwhm) in the cfhtls Wide. Each small square represents a median seeing value over
a 1o ×1o tile (or a stack) of the Wide survey. The panels show, from left to right: W1, W2, W3 and W4; from top
to bottom: the u*, g, r, i∕y and z CFHTLS stacks. |
|
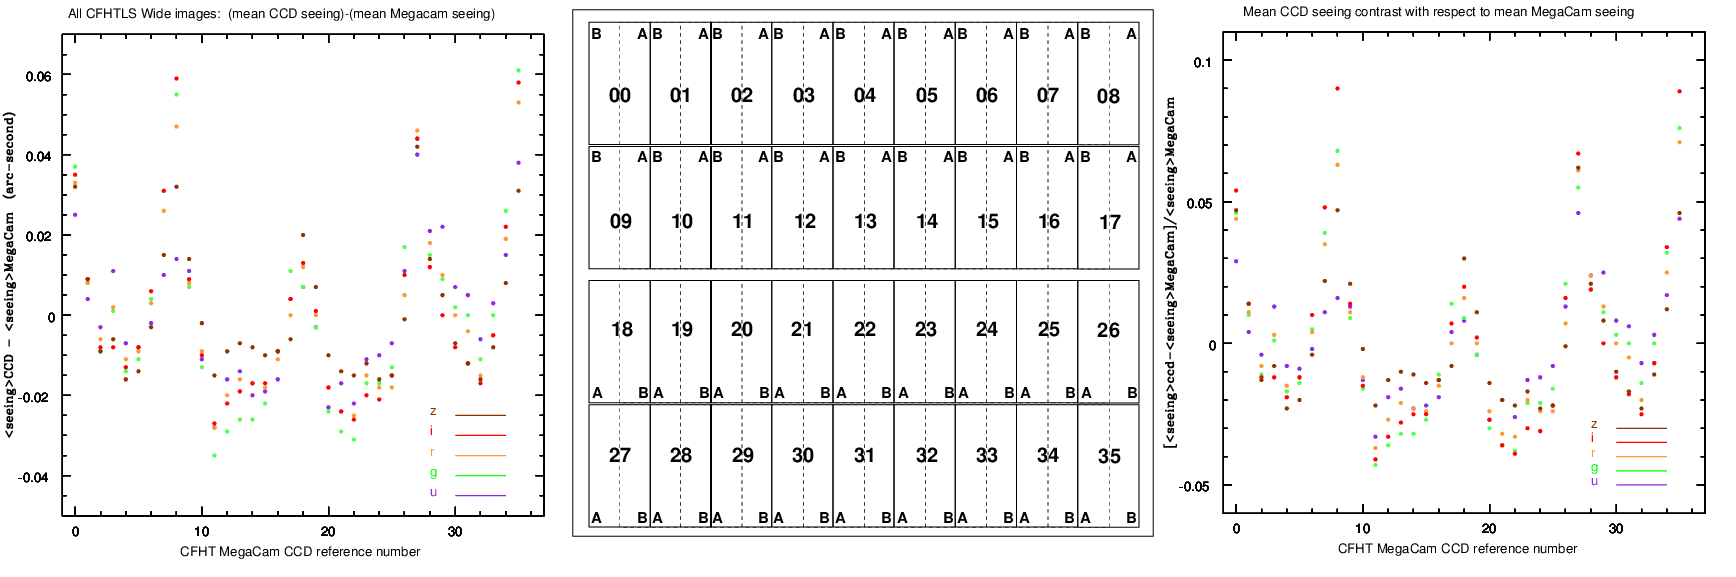
Figure 27 shows the seeing fluctuations on MegaCam. The seeing is averaged over a CCD field
of view and compared to the mean seeing over the whole MegaCam field. The statistics is based
on 6378 input images used for the CFHTLS Wide T0007 release. For CCDs at the edges of the
detector, the differences are important but never exceed 0.065", and the maximum peak-to-peak
amplitude is less than 0.1" . This upper limit is acceptable. It still preserves the mean seeing over the
whole MegaCam field of view below one arcsecond for all input images that will be combined into
stacks. The legend of Figure 27 elaborates on the extreme corners of the MegaCam field of view
which exhibit a rapid image quality degradation, but represent an area limited to just 3% of each
image.
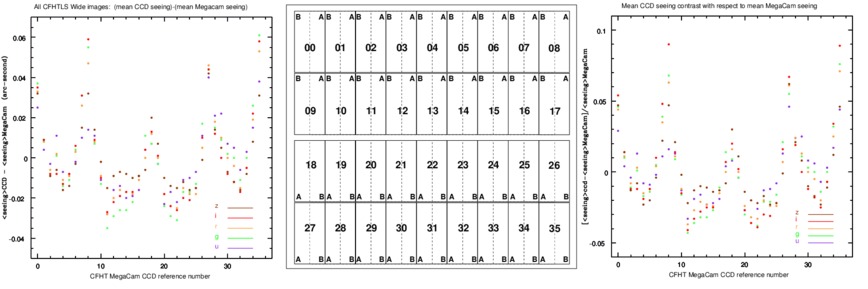
| Figure 27: | PSF variations as a function of the position on MegaCam (CCD positions) and wavelength (filters), produced by the optical distortion of the
MegaPrime wide field corrector. These statistics are based on 935 u*, 978 g, 1669 r, 1064 i and 1177 z-band images (the 220 y-band images have been
ignored here). The variations are estimated from the comparison between the mean seeing (FWHM) averaged over the MegaCam field of view and the
mean seeing averaged over a CCD field of view. The statistics are computed over the 36 CCDs composing the mosaic. The CCDs are numbered using
the CEA-CFHT CCD reference number laid out on the central figure. The left panel show the difference ⟨FHWM⟩CCD -⟨FHWM⟩MegaCam expressed
in arcseconds. The horizontal axis is the CEA-CFHT CCD reference number. One can see that for the CCDs at the edges of the detector, the differences
never exceed 0.065", and the highest peak-to-peak amplitude is less than 0.1". The right panel shows the seeing contrast |⟨FHWM⟩CCD-⟨FWHM⟩MegaCam|
⟨FWHM⟩MegaCam .
The contrast is always lower than 10% and the highest peak-to-peak contrast amplitudes are always less than 15%. Overall, the range of seeing values
over the MegaCam field of view is acceptable. However, at the extreme corners of MegaCam, the seeing difference with the mean value can be as large
as 0.25". Only the most extreme positions have a large PSF degradation and images that no longer meet the specifications of the surveys. We discard
these regions by adding extra polygons to the T0007 .reg files that mask the edges of all stacks. The fraction of the MegaCam field discarded is less
than 3%. |
|