4.5 Astrometric accuracy
The astrometric accuracy is measured in two different ways.
- Firstly, at the end of the global astrometric calibration process, by comparing the astrometric
positions of sources in all single CFHTLS images with sources in an internal and an external
reference catalogue. This astrometric calibration error represents the upper limit for the
astrometric accuracy of the survey.
- Secondly, by comparing position of sources inside each CFHTLS Wide stack with respect to
an external reference catalogue. This astrometric accuracy of CFHTLS stacks measures the final
absolute astrometric accuracy of each stack and their corresponding catalogues.
The astrometric calibration of the Wide survey is described in Section 3.5.
4.5.1 Astrometric calibration errors
The mean internal astrometric calibration errors are derived using the cross-identifications of sources
inside the overlapping regions of adjacent fields (see Fig. 21). All single input MegaCam Wide,
Pre-Wide (see Fig. 21) and short photometric exposures images remaining after selection are included.
The cross-identifications and the internal errors are obtained during the SCAMP calibration process.
The calibrations outputs of the Wide fields W1, W2, W3 and W4 are available from the synoptic
table.
Over the whole survey, the mean internal rms error is
 | (16) |
where the reported errors are not the SCAMP internal errors, but the mean absolute difference of the internal errors
between the four Wide fields and the mean error values. Since the four fields are calibrated independently, the
errors quoted above are approximate; the internal errors for W1, W2, W3 and W4 are given in Table
??.
For each field, the mean rms external RA and DEC errors of the astrometric solution are derived during the
SCAMP calibration process, using the cross-identification of sources inside each single CFHTLS Wide
image with the 2MASS catalogue. The mean external calibration errors over the whole survey are
σRA = 0.239” and σDEC = 0.232”. They roughly correspond to the internal errors of the 2MASS
catalogue.
The mean scatter from one Wide field to another is uncertain, because the CFHTLS is made of only four
independent fields. It can be estimated from the offsets of the mean external errors of each field separately with
respect to the mean value over the four fields. The offsets are listed in Table 12. The amplitudes
are very close to the internal astrometric calibration errors of the Wide fields, hence we conclude
that the internal astrometric accuracy for the CFHTLS Wide does not have significant field-to-field
scatter.
|
|
| | | | | | Field | RA diff. | DEC diff. |
| | ["] | ["] |
| | | |
|
|
| | | |
| W1 | +0.014 | +0.010 |
| W2 | -0.035 | -0.025 |
| W3 | +0.011 | +0.010 |
| W4 | -0.026 | -0.023 |
| | | |
|
|
| | |
| Table 12: | Mean RA and DEC differences between the external errors in each field and the mean external errors,
averaged over the four Wide fields. |
|
4.5.2 Absolute astrometric accuracy of the CFHTLS stacks
The astrometric accuracy inside each stack is measured by comparing the source positions in the final CFHTLS
catalogues produced from all stacks with the 2MASS source catalogue. The results are given in the
QualityFITS-out (QFITS-out) evaluation web pages. The mean external astrometric errors inside each stack are
given by the rms of the the positions of each source inside a stack with respect to an external reference catalogue
(2MASS). The results are listed in Table 13. They are in excellent agreement with the external errors from the
internal astrometric calibration.
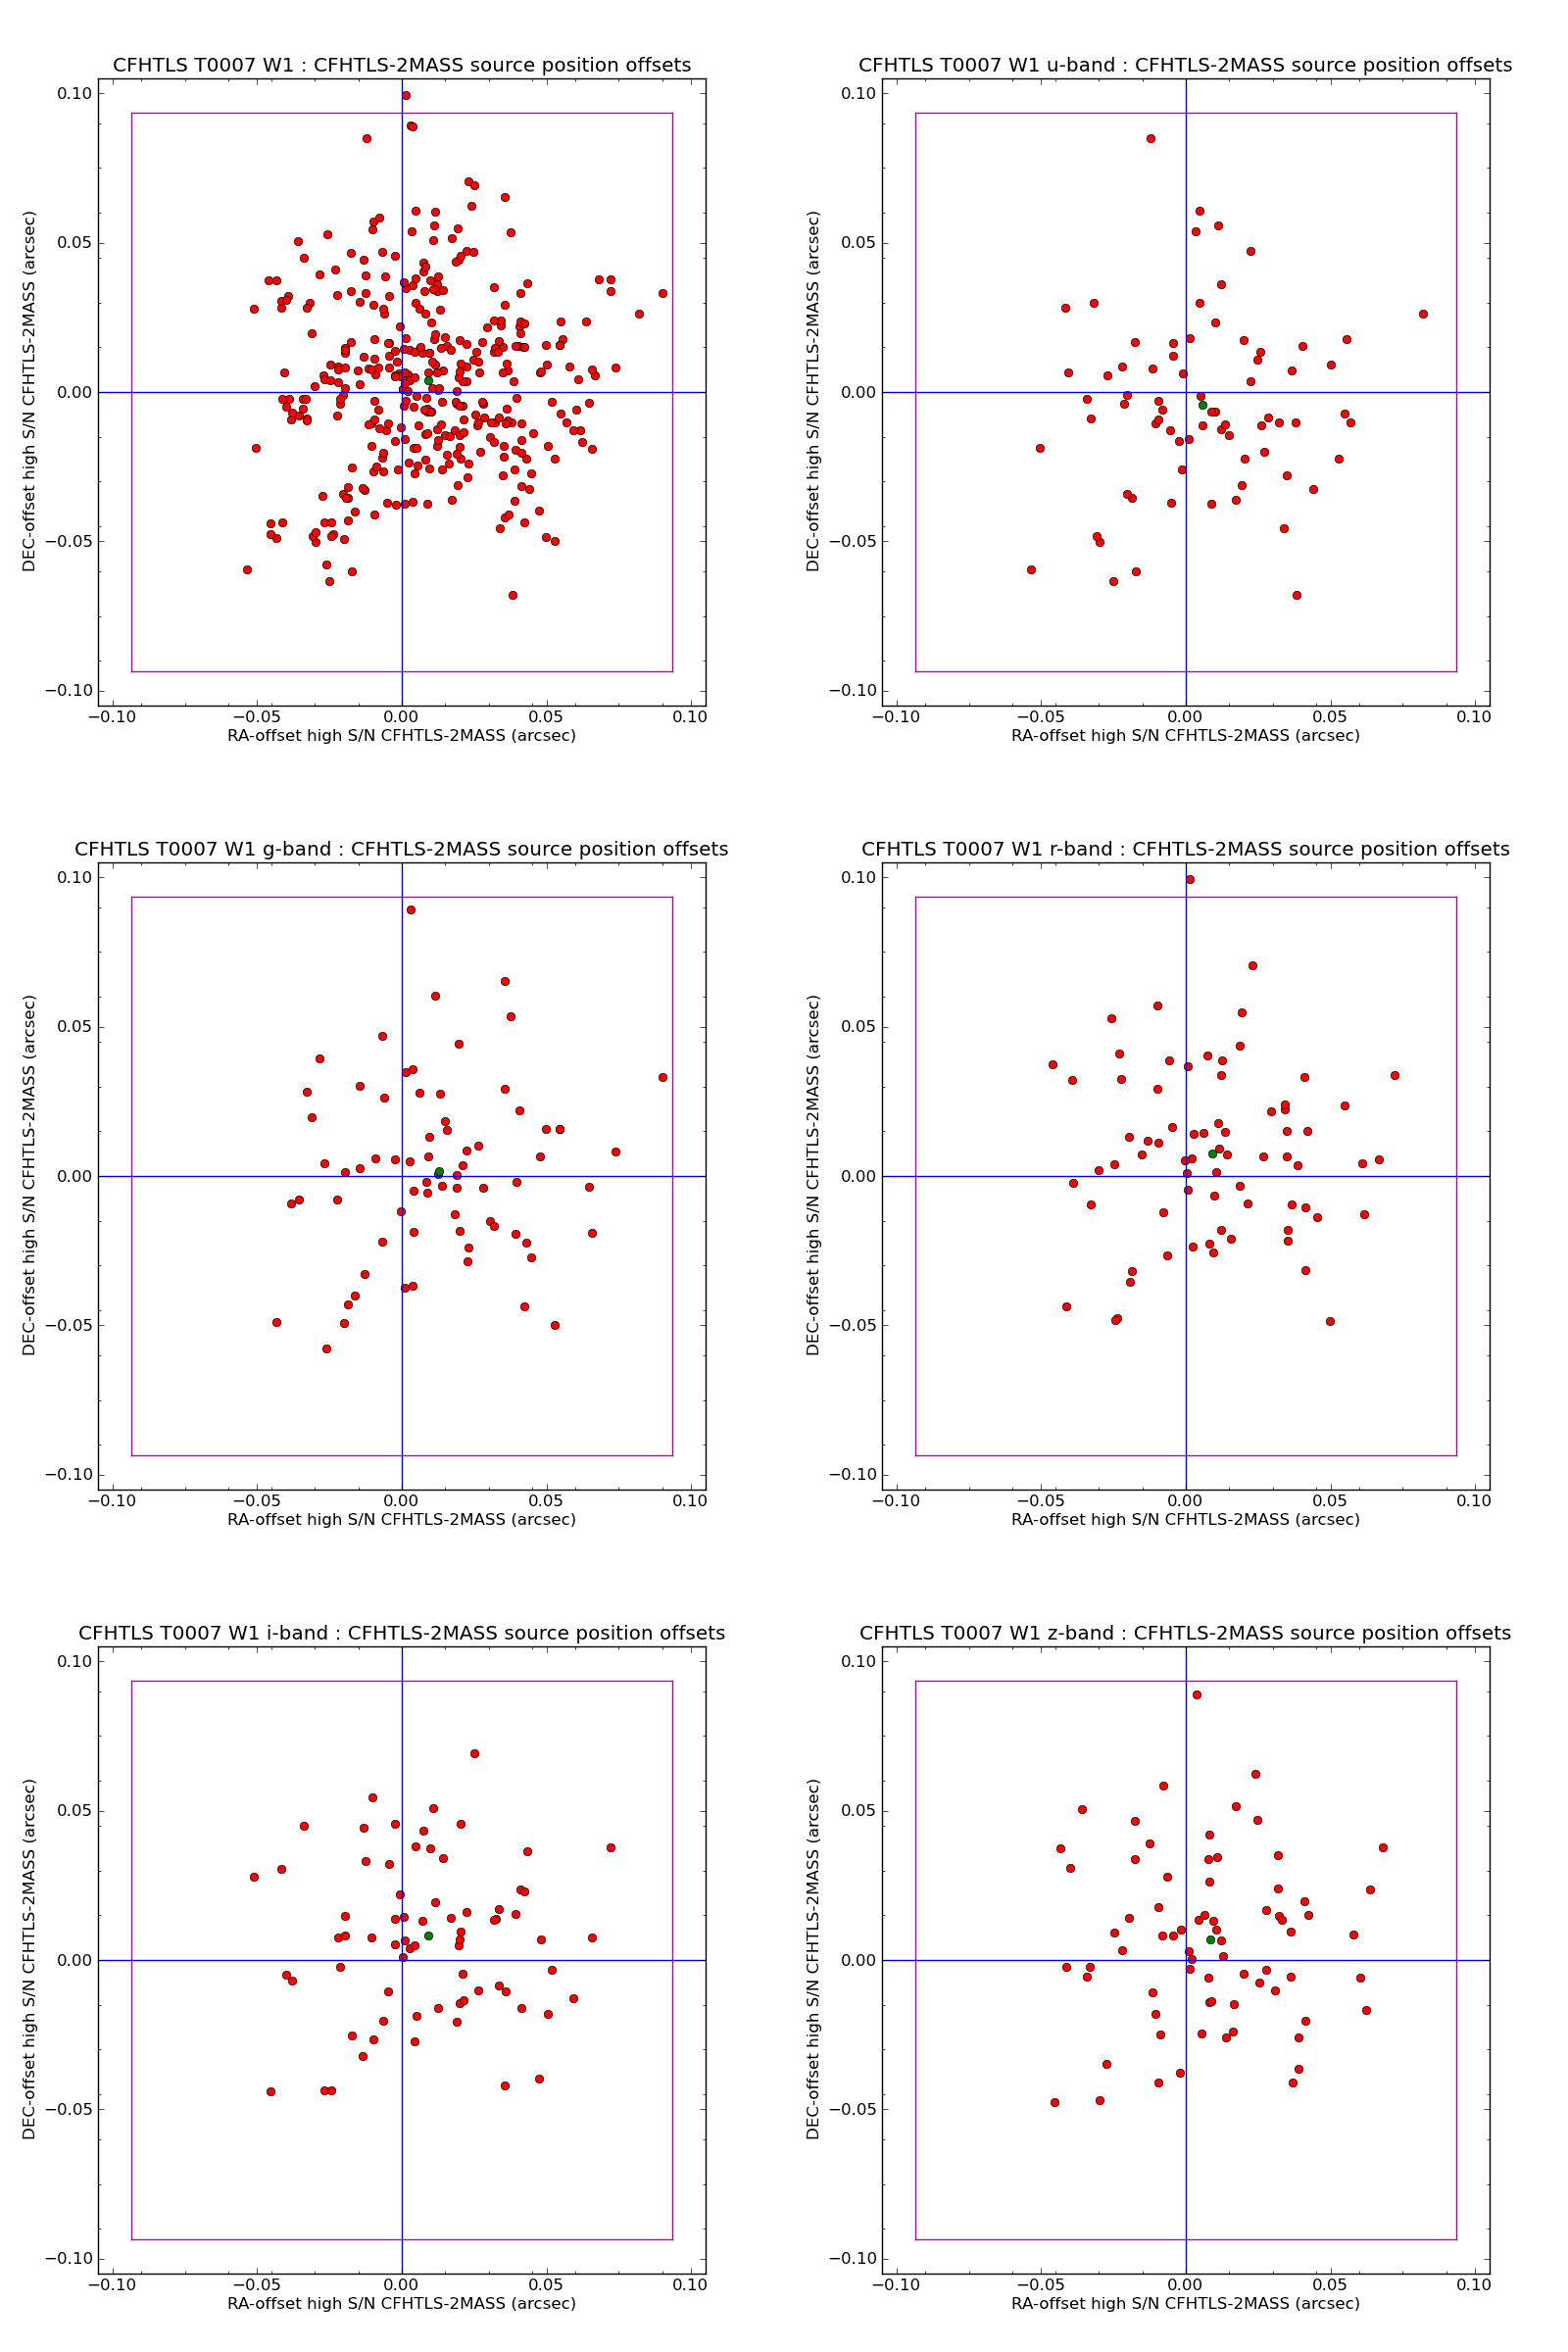
To control whether systematic offsets of source coordinates are present inside each Wide catalogue, we inspected
and averaged over all stacks composing each Wide field the mean offsets ⟨ΔRACFHTLS-2MASS⟩ and
⟨ΔDECCFHTLS-2MASS⟩, between the the CFHTLS and 2MASS positions inside a stack. The significance of the
offsets is given by comparing the rms of the average of the mean offset value with the rms of the mean external
errors, averaged over the number of field per Wide tile (72 for W1, 25 for W2, 49 for W3 and 25 for
W4). The results are listed in Table 13 and detailed in Fig. 39, 40, 41, and 42, for the four Wide
patches, globally and as a function of filter. All fields with the exception of W1 show small offsets.
They are perceptible in both amplitude and direction and in all filters, but vary from a Wide tile
to another. The amplitude is nevertheless small (about 1/10 of the CFHTLS pixel size) and never
larger than the 1-σ rms offset error, the 1-σ rms error of the external error or the mean internal
astrometric errors of the Wide astrometric calibration. Furthermore, we do not see significant chromatic
effects.
Figures 39 to 42 also show only a few outliers stacks with large astrometric offsets with respect to
the 2MASS source positions. The most extreme fields are listed in the next sections. However,
the number of outliers with an amplitude of the deviation of more than 3-σ deviations in at least
one direction is close to Gaussian expectations (9/360 for W1, 1/245 for W3, 0/125 for W2 and
W4).
|
|
|
|
| | | | | | | | Wide Field - Filter | Wide-averaged MegaCam-mean astrometric | Wide-averaged MegaCam mean external
| | | offset with respect to 2MASS | rms astrometric error
| | | | | | | | | ⟨ΔRA
CFHTLS-2MASS⟩ | ⟨ΔDECCFHTLS-2MASS⟩ | σRA | σDEC |
| | [”] | ["] | ["] | ["] |
| | | | | |
|
|
|
|
| | | | | | |
| W1 - all bands | 0.009 ±0.028 | 0.004 ±0.029 | 0.253 ±0.019 | 0.242 ±0.021 | | W1 u-band | 0.006 ± 0.028 | -0.004 ± 0.029 | 0.237 ± 0.019 | 0.227 ± 0.023 |
| W1 g-band | 0.013 ±0.028 | 0.002 ±0.029 | 0.254 ±0.016 | 0.244 ±0.019 |
| W1 r-band | 0.009 ±0.028 | 0.008 ±0.029 | 0.259 ±0.014 | 0.247 ±0.016 | | W1 i-band | 0.011 ± 0.027 | 0.006 ± 0.028 | 0.252 ± 0.014 | 0.243 ± 0.017 |
| W1 y-band | 0.002 ±0.028 | 0.015 ±0.027 | 0.272 ±0.014 | 0.254 ±0.020 |
| W1 z-band | 0.008 ±0.027 | 0.007 ±0.028 | 0.260 ±0.017 | 0.248 ±0.019 | | | | |
| W2 - all bands | -0.006 ±0.018 | 0.015 ±0.013 | 0.204 ±0.014 | 0.207 ±0.013 | | W2 u-band | -0.008 ± 0.017 | 0.014 ± 0.014 | 0.183 ± 0.009 | 0.186 ± 0.011 |
| W2 g-band | -0.005 ±0.018 | 0.015 ±0.014 | 0.208 ±0.008 | 0.211 ±0.007 |
| W2 r-band | -0.005 ±0.019 | 0.015 ±0.012 | 0.211 ±0.009 | 0.213 ±0.008 | | W2 i-band | -0.004 ± 0.019 | 0.016 ± 0.013 | 0.207 ± 0.007 | 0.210 ± 0.006 |
| W2 y-band | -0.004 ±0.020 | 0.020 ±0.008 | 0.224 ±0.009 | 0.228 ±0.010 |
| W2 z-band | -0.007 ±0.019 | 0.013 ±0.013 | 0.211 ±0.008 | 0.212 ±0.008 | | | | |
| W3 - all bands | -0.002 ±0.018 | -0.013 ±0.024 | 0.250 ±0.017 | 0.242 ±0.016 | | W3 u-band | -0.003 ± 0.018 | -0.005 ± 0.022 | 0.235 ± 0.014 | 0.225 ± 0.014 |
| W3 g-band | -0.002 ±0.019 | -0.011 ±0.022 | 0.248 ±0.015 | 0.242 ±0.012 |
| W3 r-band | -0.002 ±0.018 | -0.016 ±0.023 | 0.258 ±0.013 | 0.249 ±0.012 | | W3 i-band | -0.002 ± 0.018 | -0.016 ± 0.022 | 0.246 ± 0.014 | 0.242 ± 0.013 |
| W3 y-band | 0.008 ±0.018 | -0.047 ±0.020 | 0.275 ±0.016 | 0.269 ±0.012 |
| W3 z-band | -0.002 ±0.018 | -0.014 ±0.023 | 0.258 ±0.012 | 0.250 ±0.012 | | | | |
| W4 - all bands | 0.015 ±0.019 | 0.010 ±0.018 | 0.213 ±0.015 | 0.209 ±0.017 | | W4 u-band | 0.014 ± 0.019 | 0.009 ± 0.017 | 0.193 ± 0.012 | 0.186 ± 0.015 |
| W4 g-band | 0.015 ±0.020 | 0.010 ±0.018 | 0.218 ±0.010 | 0.213 ±0.012 |
| W4 r-band | 0.017 ±0.019 | 0.010 ±0.018 | 0.222 ±0.011 | 0.217 ±0.013 | | W4 i-band | 0.014 ± 0.020 | 0.010 ± 0.021 | 0.217 ± 0.011 | 0.215 ± 0.014 |
| W4 y-band | 0.020 ±0.015 | 0.006 ±0.014 | 0.221 ±0.009 | 0.217 ±0.010 |
| W4 z-band | 0.012 ±0.018 | 0.011 ±0.018 | 0.214 ±0.012 | 0.212 ±0.013 | | | | | | |
|
|
|
|
| | |
| Table 13: | Mean astrometric position accuracy of each Wide stack. The Wide-averaged statistics is the ensemble average over all stacks of the mean CFHTLS-SDSS
astrometric offset values computed for each stack (MegaCam mean), separately |
|
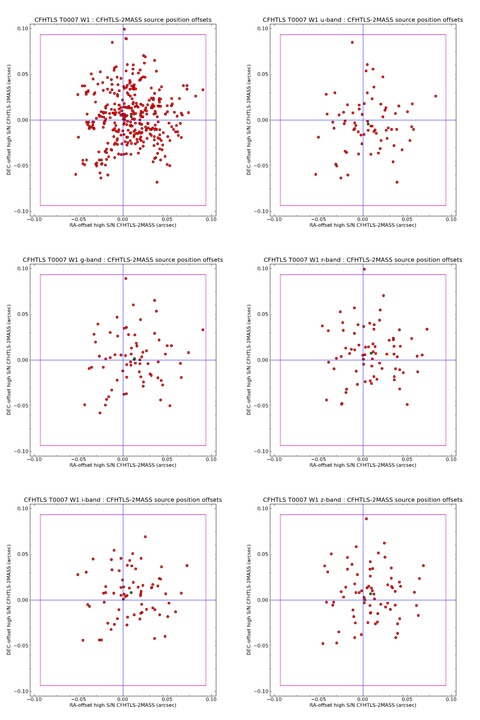
| Figure 39: | Mean RA-DEC offsets between the CFHTLS W1 and the 2MASS catalogues. The offset is
derived from the ensemble average over all Wide W1 stacks of the mean offset inside each W1 stack.
The top left plot shows the offset using all filters together (360 stacks). The other plots show the offsets
in each filter (72 stacks per filter). The red dots show the mean offset in each stack. The green dot show
the ensemble average of all stacks. The magenta square shows the MegaCam pixel size (0.186"). |
|
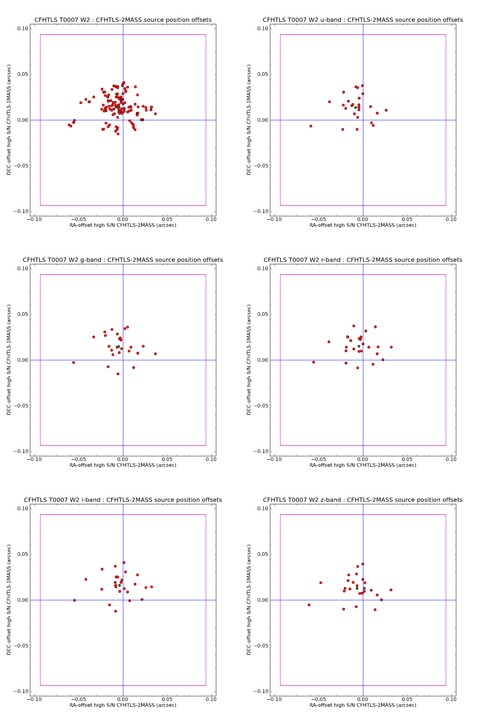
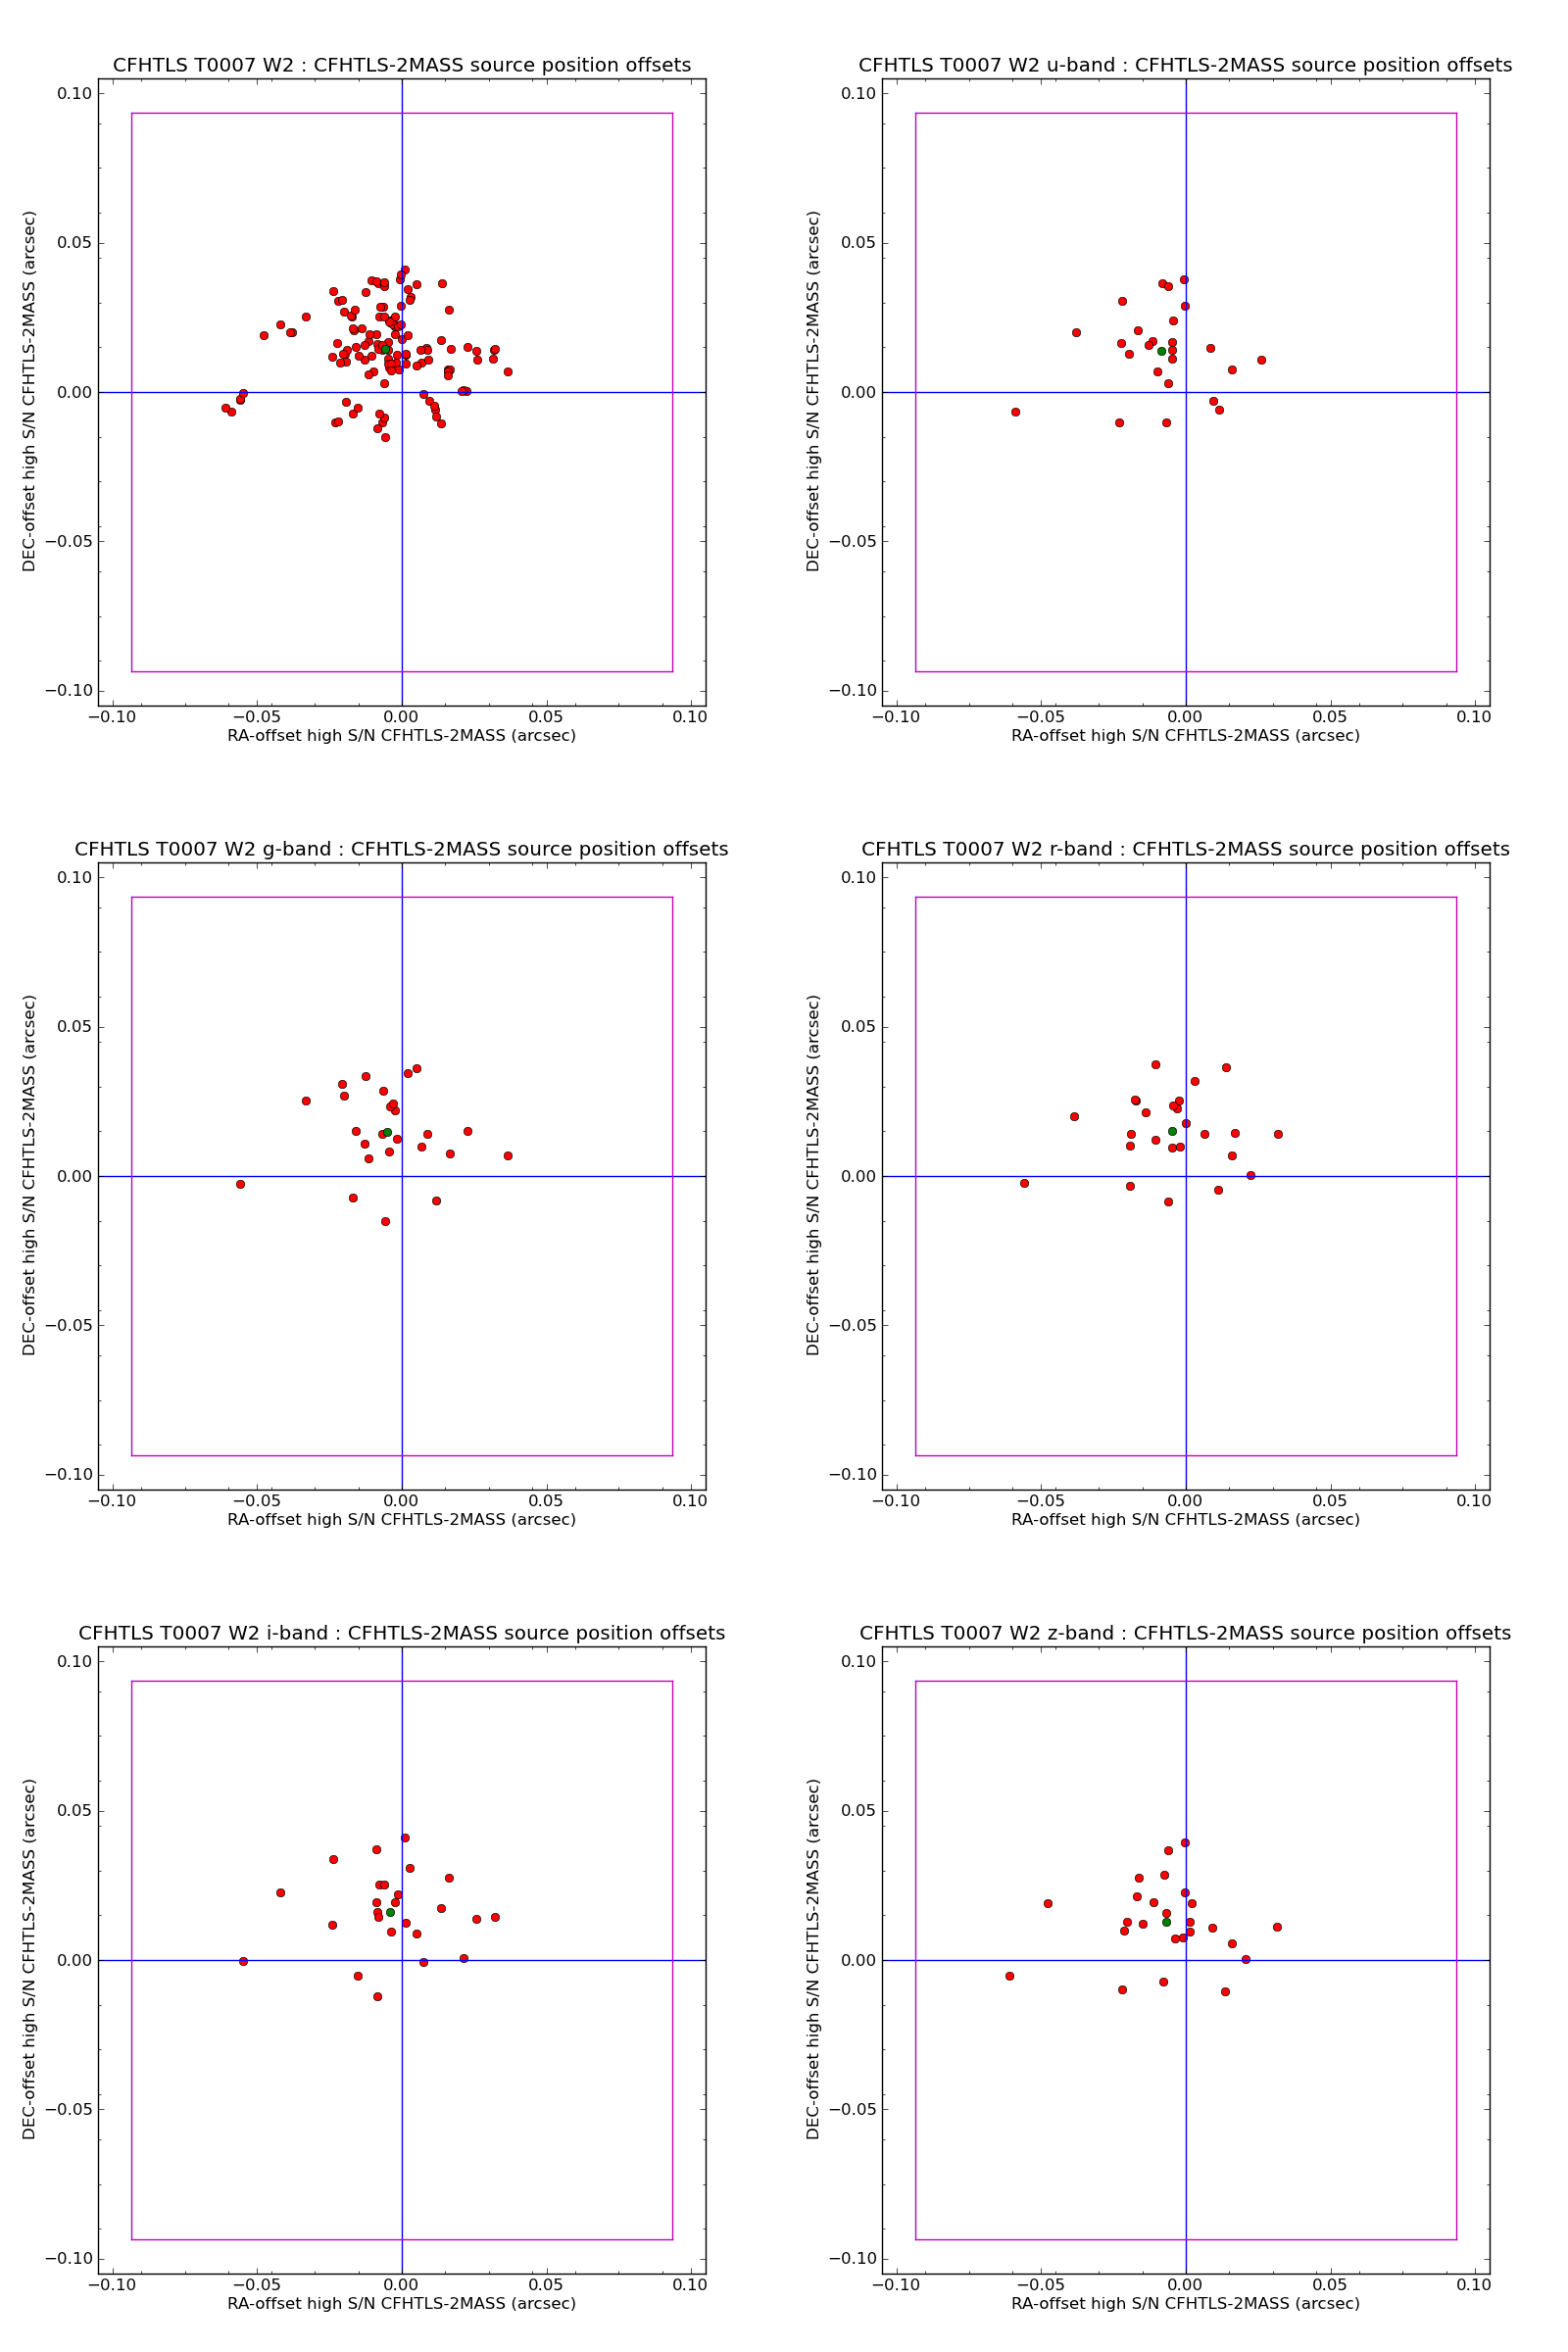
| Figure 40: | Mean RA-DEC offsets between the CFHTLS W2 and the 2MASS catalogues (see comments on the
caption of Fig. 39). |
|
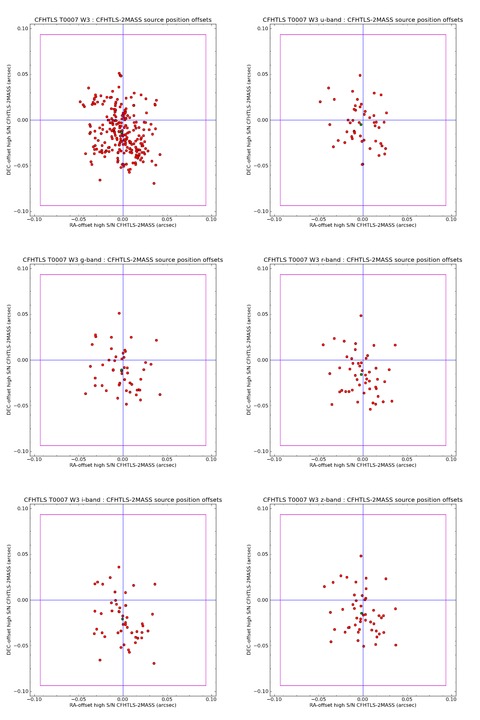
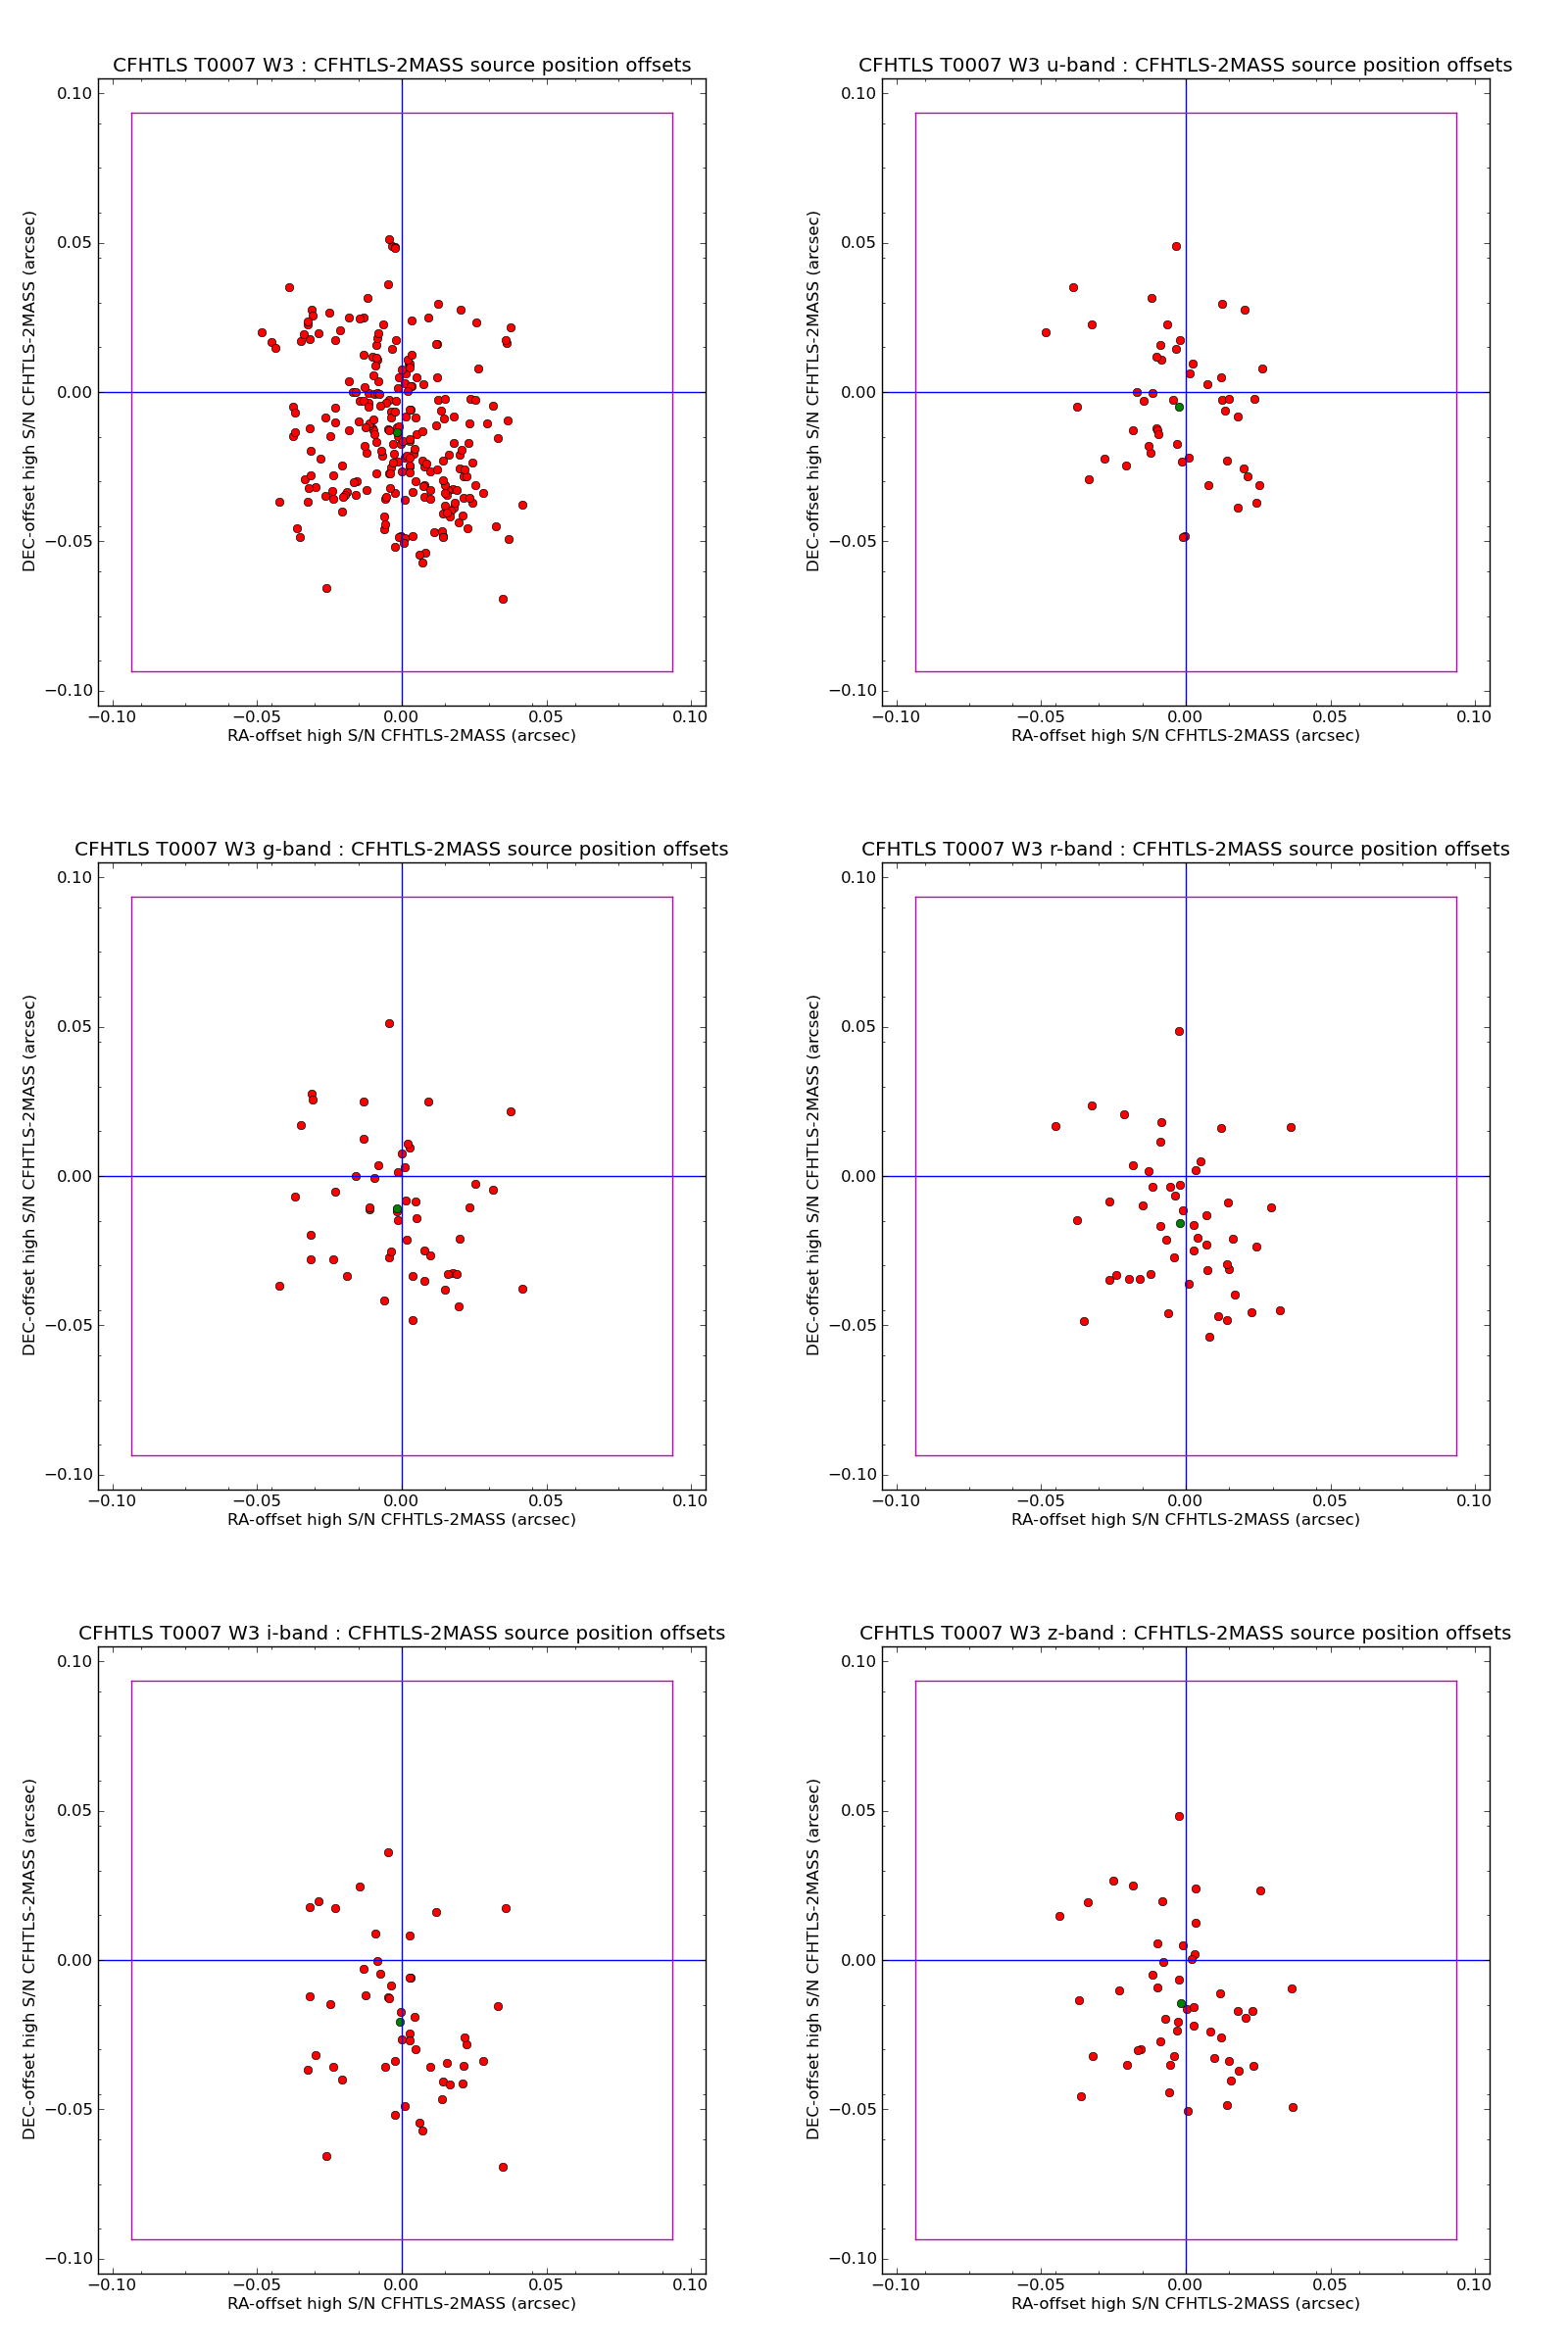
| Figure 41: | Mean RA-DEC offsets between the CFHTLS W3 and the 2MASS catalogues (see comments on the
caption of Fig. 39). |
|
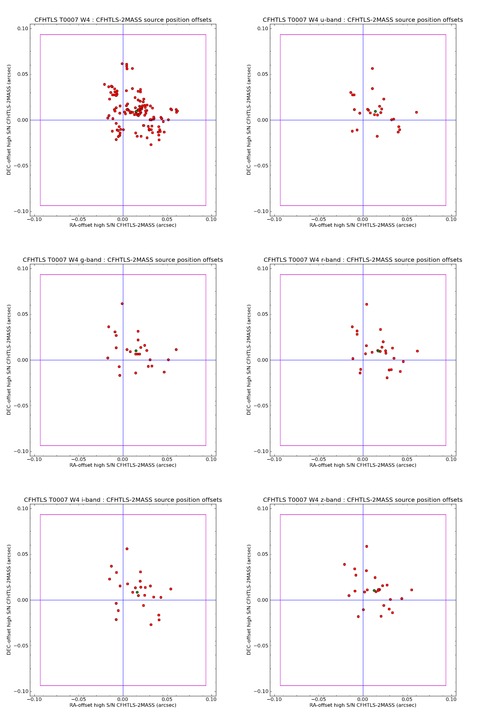
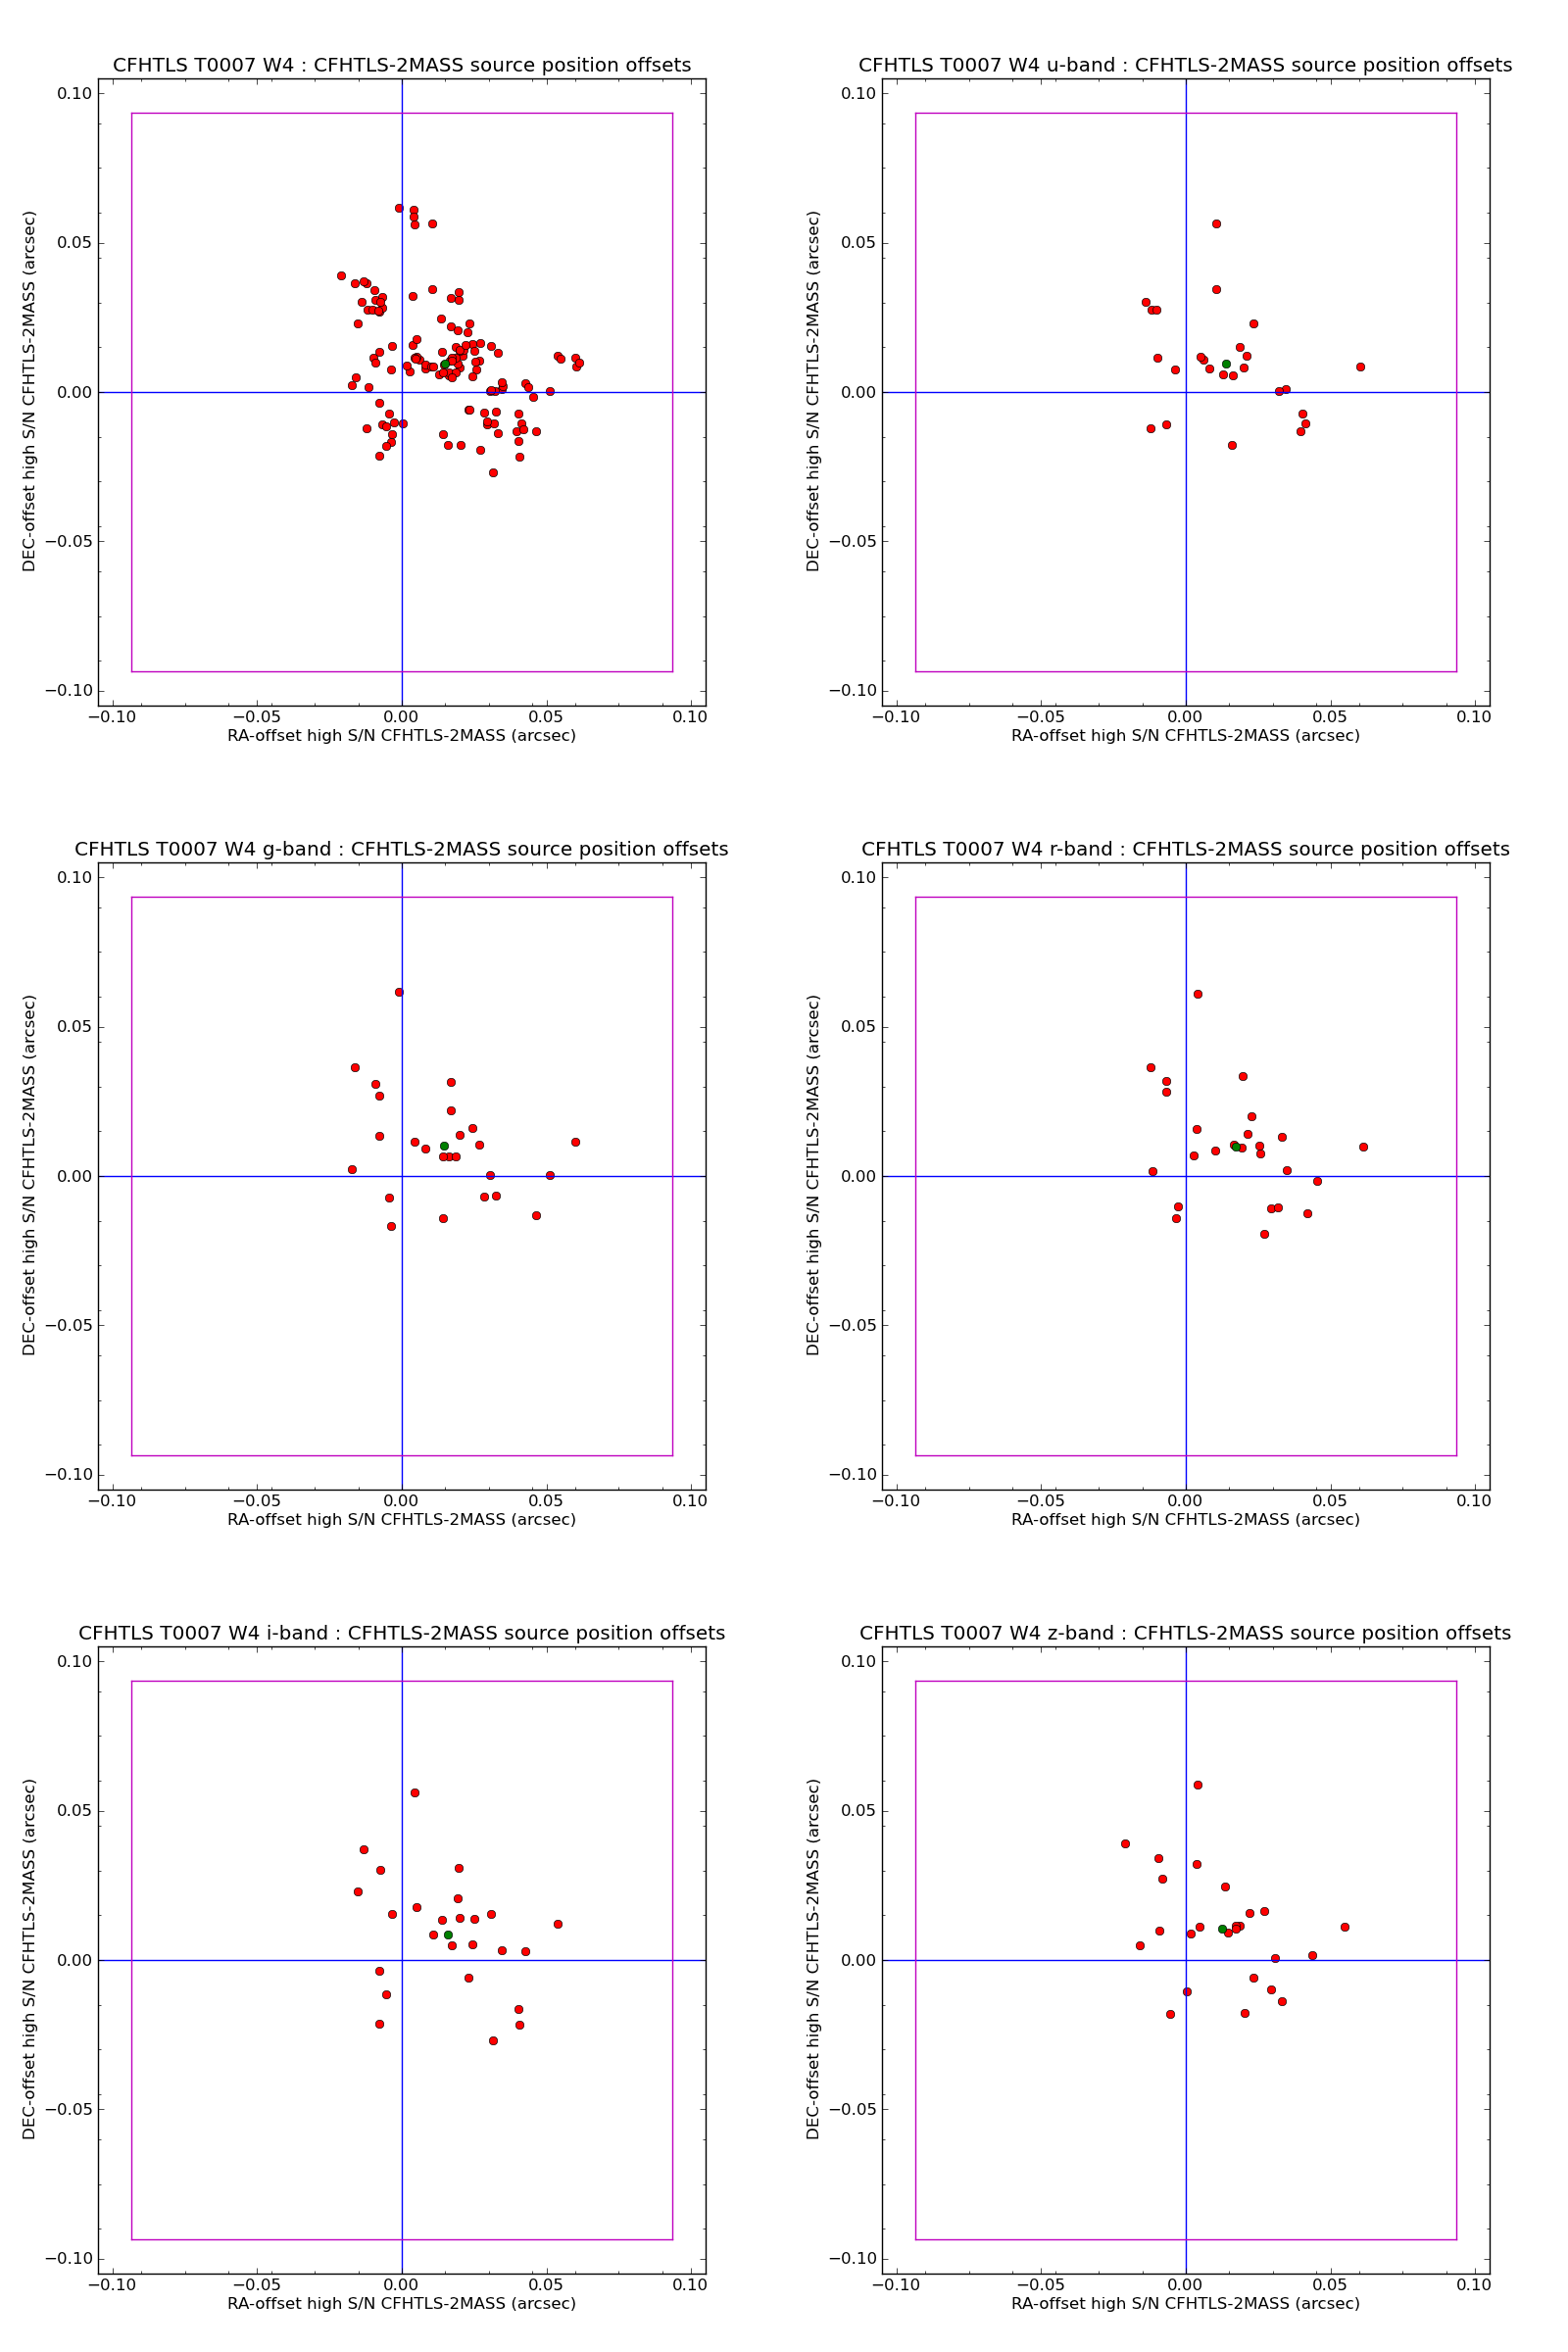
| Figure 42: | Mean RA-DEC offsets between the CFHTLS W4 and the 2MASS catalogues (see comments on the
caption of Fig. 39). |
|