

In the VIRMOS-VVDS F10 field, the counts in cells measurements show a lot of power on large angular scales, as shown below -- this is evidence that the photometric measurements are inhomogenous at these scales. As suggested by Olivier at the last science meeting, we've looked in detail at the galactic extinction values on this field (the catalogue generated by Sebastien had no galactic extinction applied to it).
 Counts in cells measurements before extinction correction |
The image below shows a greyscale plot of the E(B-V) across the F10 field (generated from a FITS file supplied by Mario). The peak-to-trough extinction in this plot is around 0.15 magnitudes!
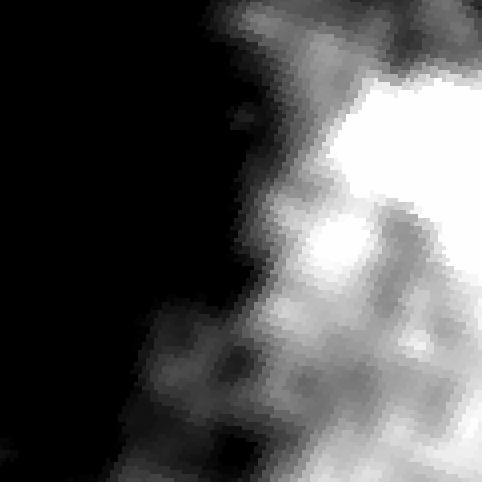 E(B-V) measurements for the F10 field. |
After seeing this plot it was clear that it wouldn't be appropriate to apply a unique extinction value for the entire field. As 'quick and dirty' solution I simply took the *entire* catalogue and computed the extinction appropriate for *each* galaxy, then re-applied the magnitude cut and re-calculated the counts in cells. The result is shown below.
 Counts in cells measurements with dust correction |
So it seems we really should correct for galactic extinction on a much finer grid, at least for this field -- probably at the resolution of the Schlegel maps. I haven't looked at the 22hr and 02hr field, but for sure this is something we should investigate.