


This page summarises the first analyses of Megacam images and a pre-release of some CFHTLS data. This evaluation was done in order to provide first Megacam images to CFHTLS users and to show the potential of the CFHTLS for science.
An explanatory text can be found after the table.
If you need more information, please contact Terapix: terapix at iap.fr .
Release date: March 15, 2004.
| Target | |||||
| Number of images | |||||
| Total Exp. time | |||||
| Total area /
Effective area (unmasked) | 0.79 deg2 | ||||
| Averaged seeing | |||||
| Mag. ZP | |||||
| png image | 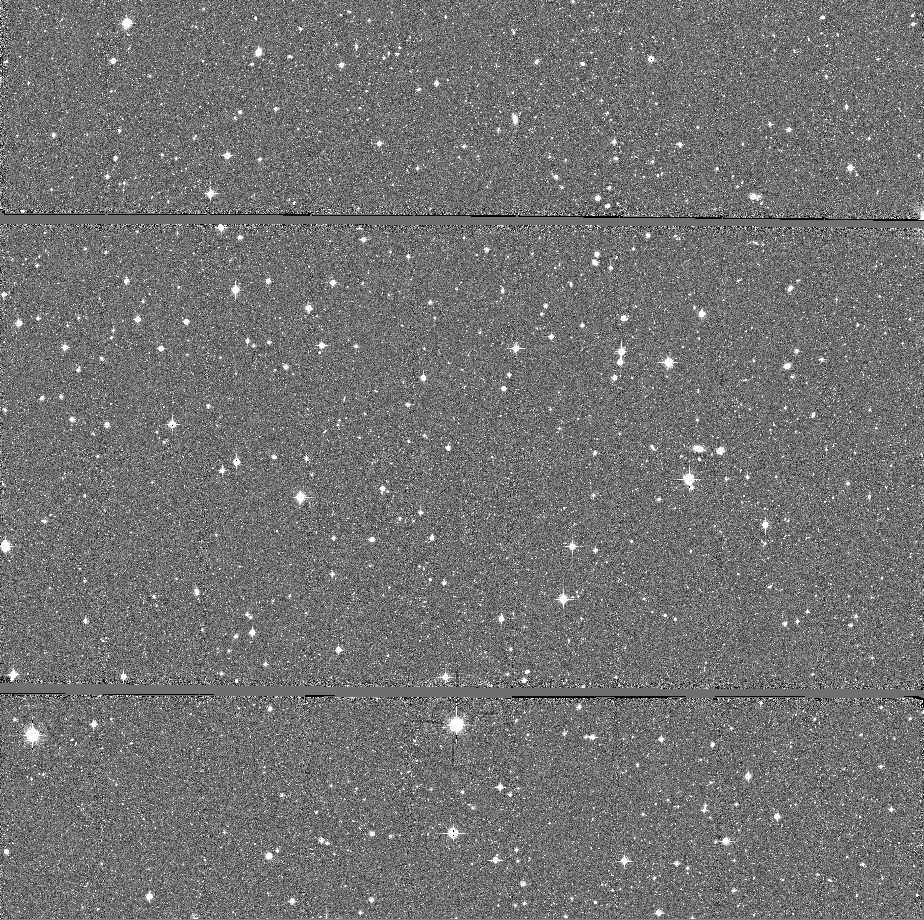 | 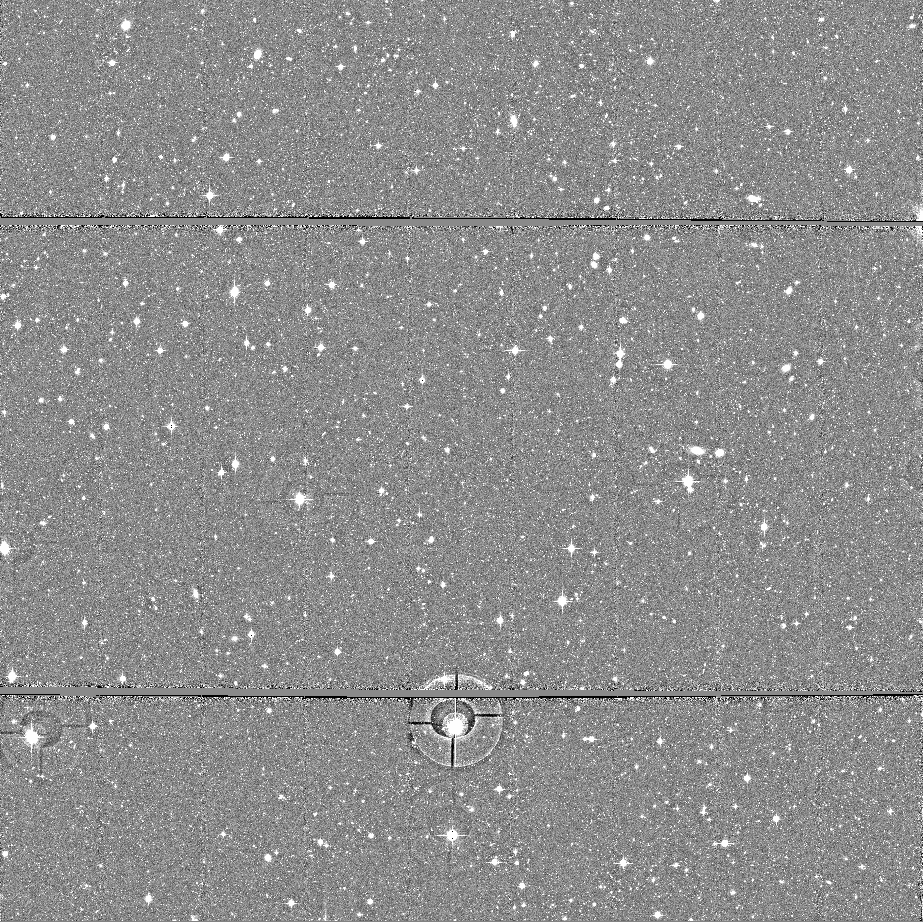 | 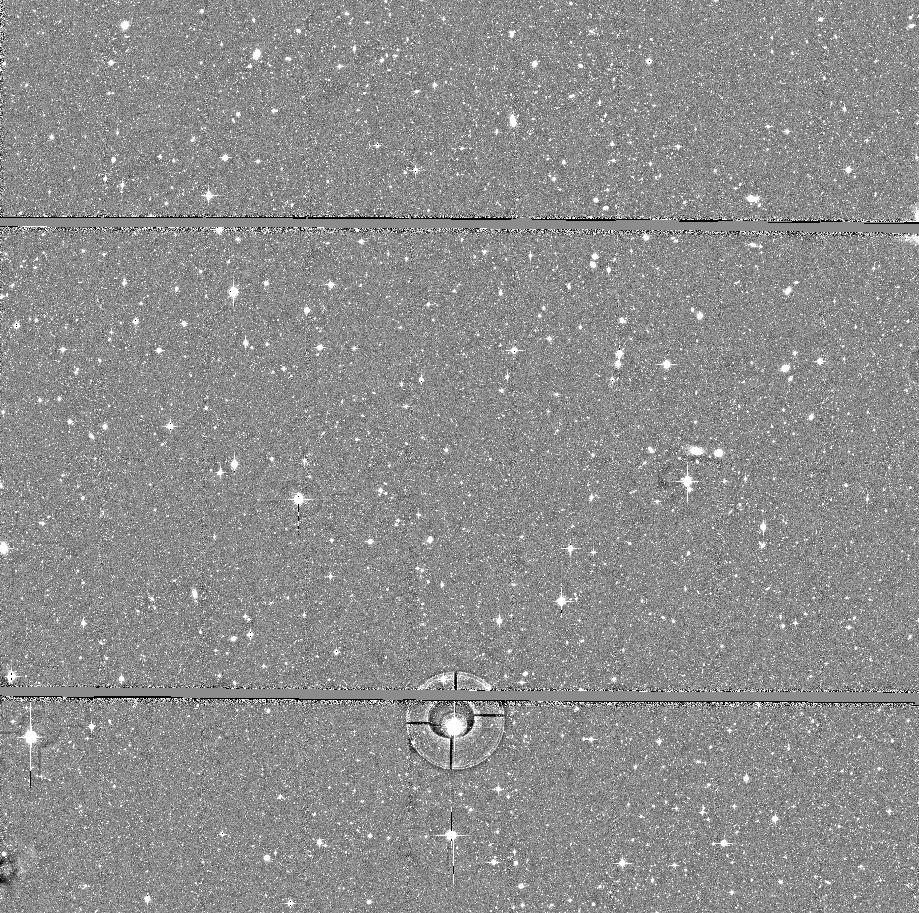 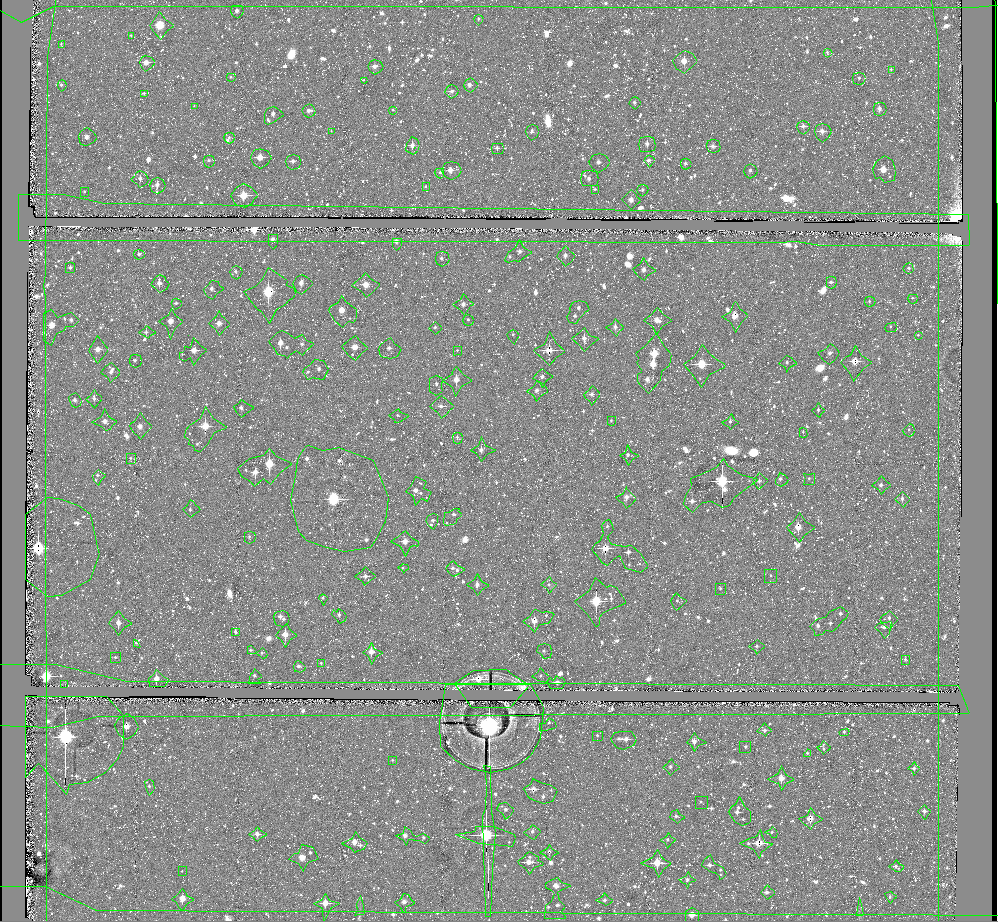 | 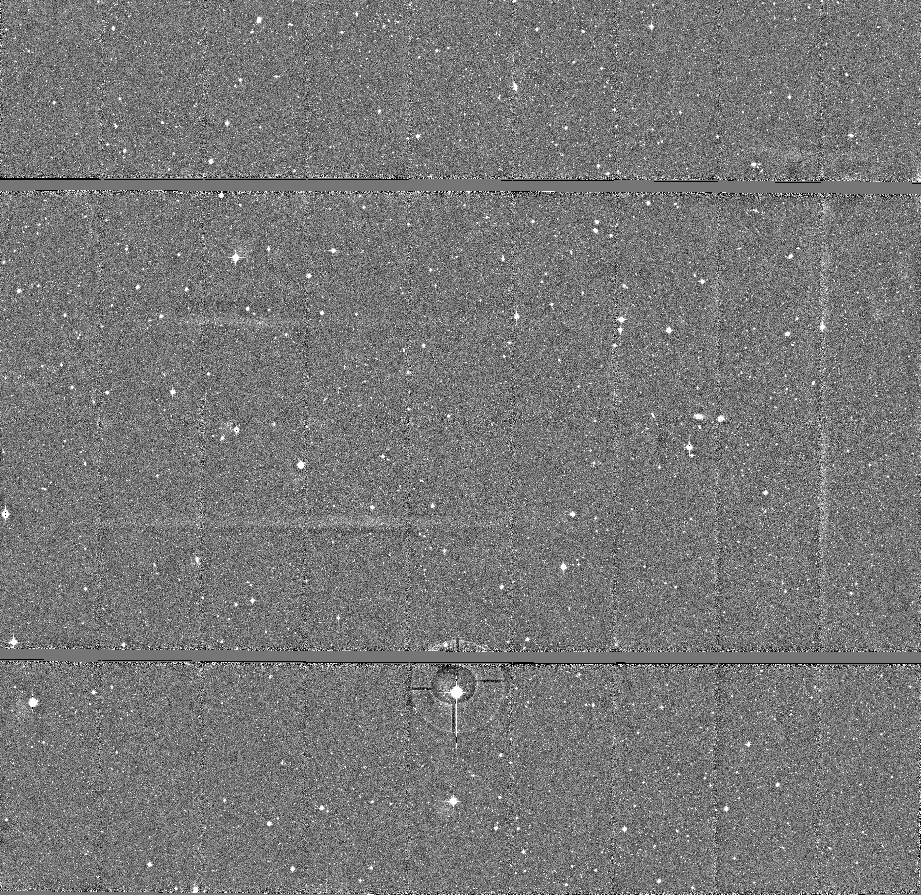 | |
| rh-mag plot | 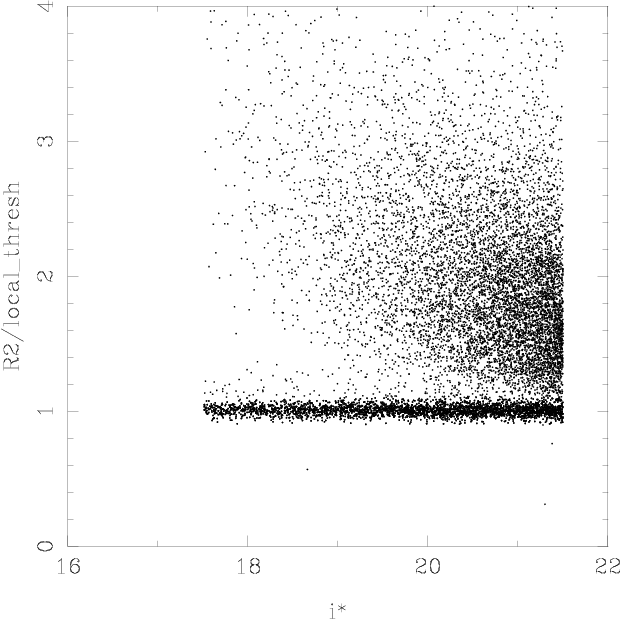 | ||||
| Galaxy counts |  | ||||
| Stellar counts | 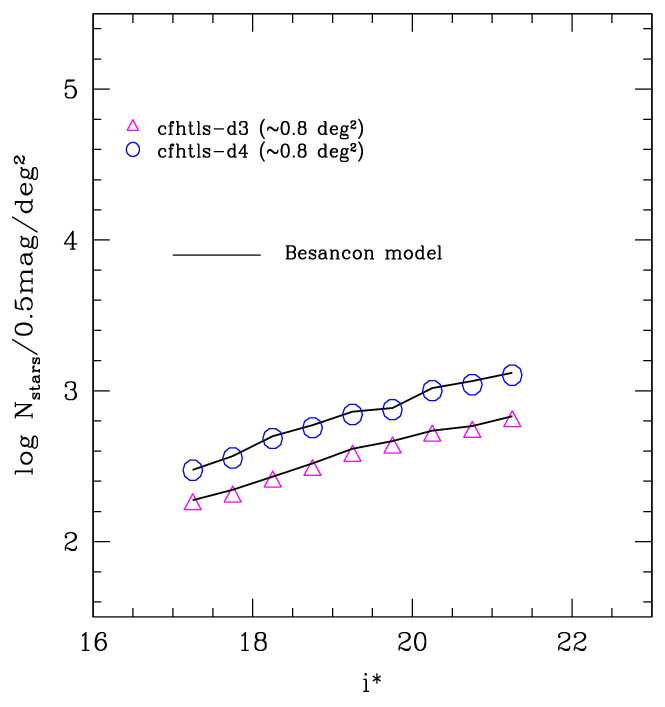 | ||||
| Completeness | 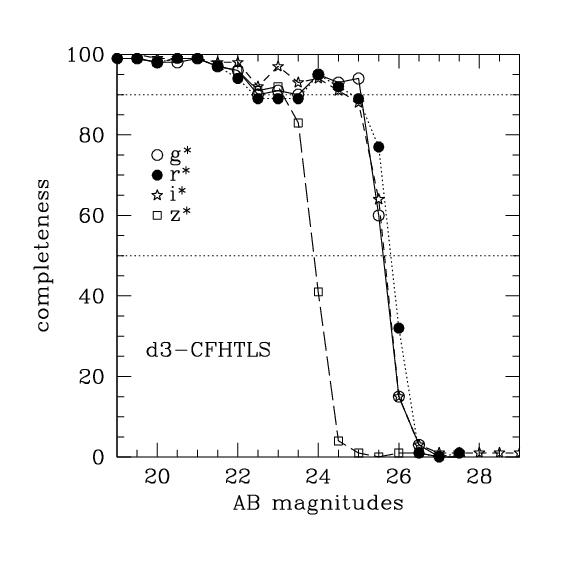 | 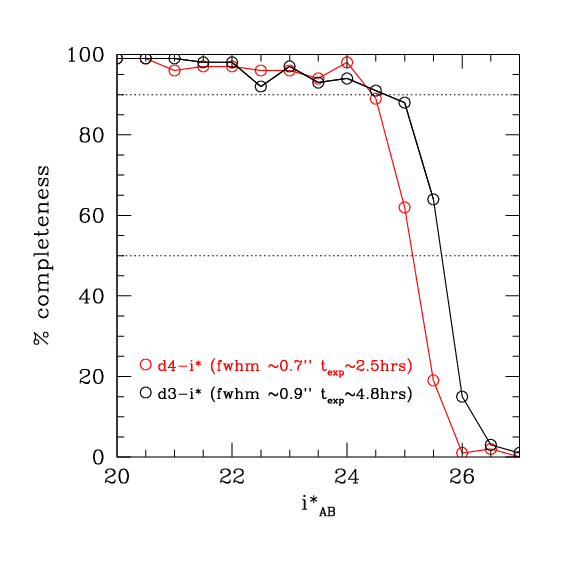 | |||
| Stellar color-color plot | 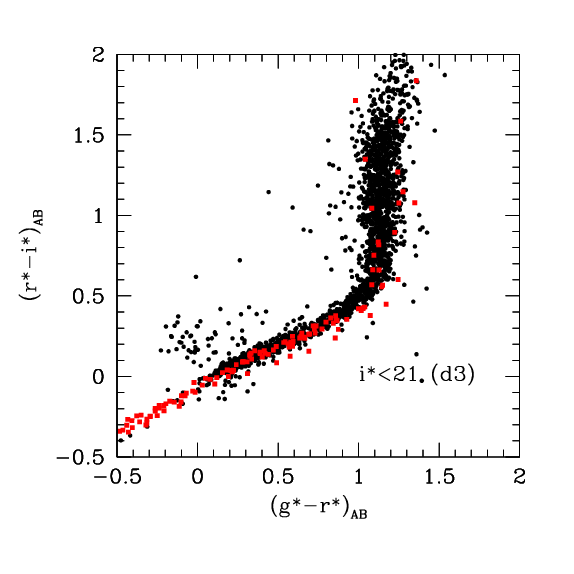 | 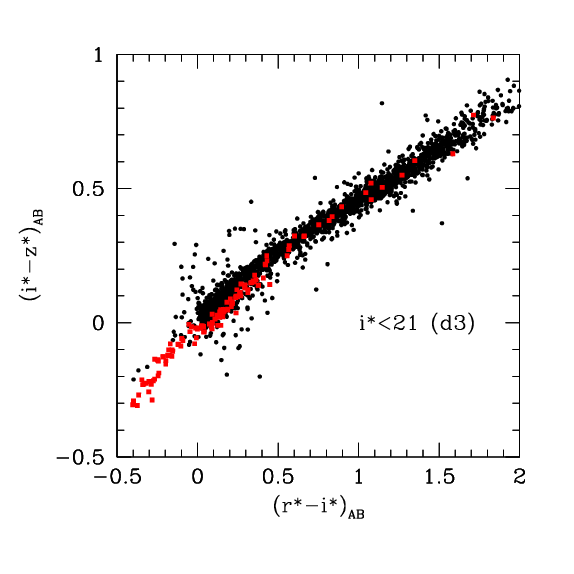 | |||
| Stellar 2-pts
correlation function | 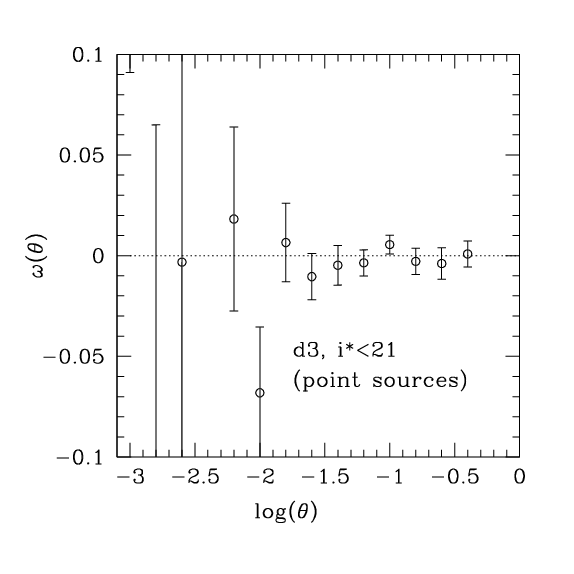 | ||||
| Astrometric calibration: relative to i, and i relative to USNO | 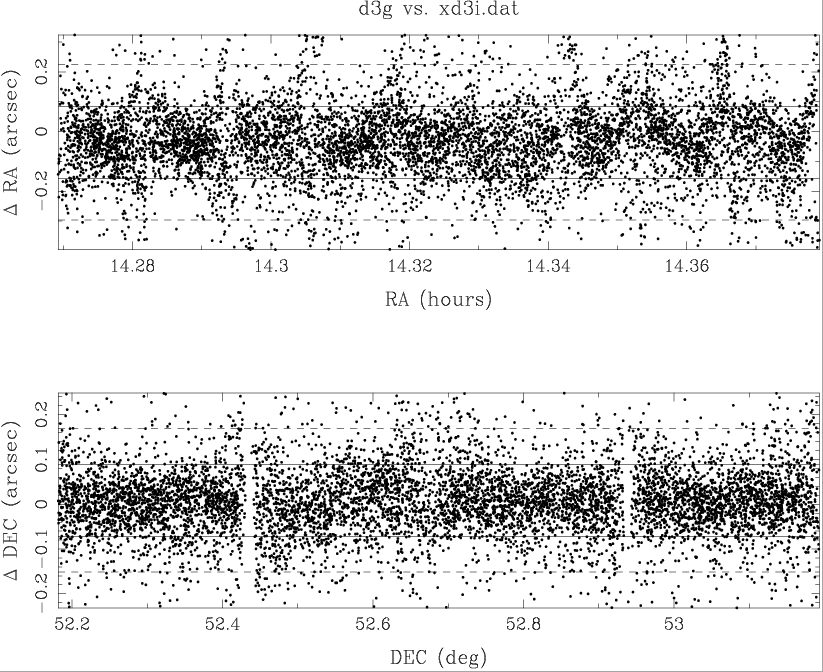 | 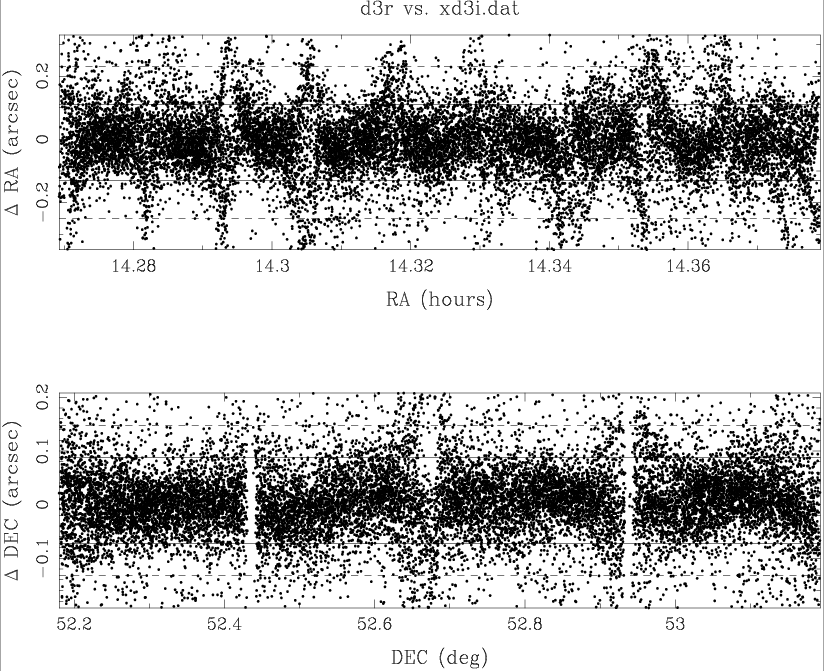 | 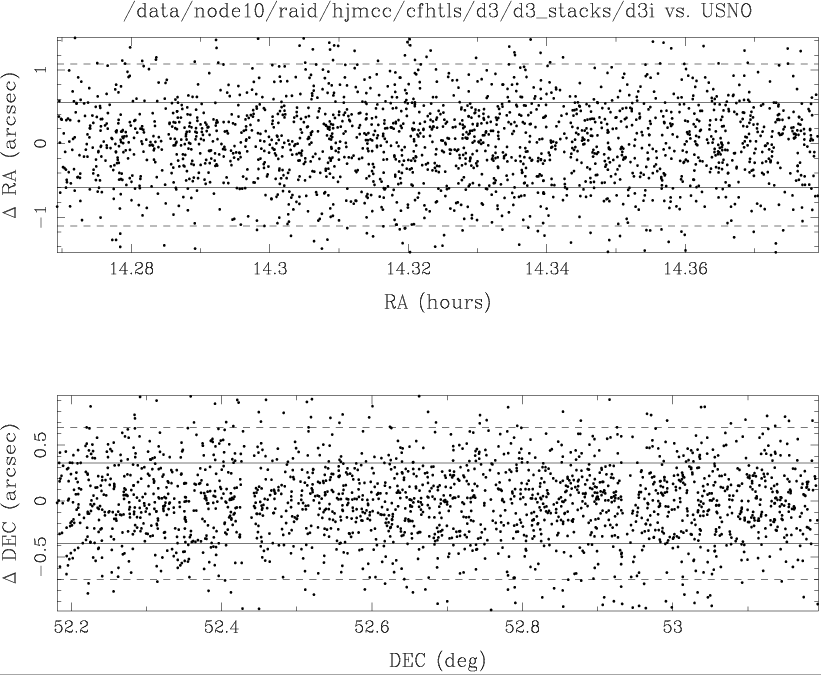 | 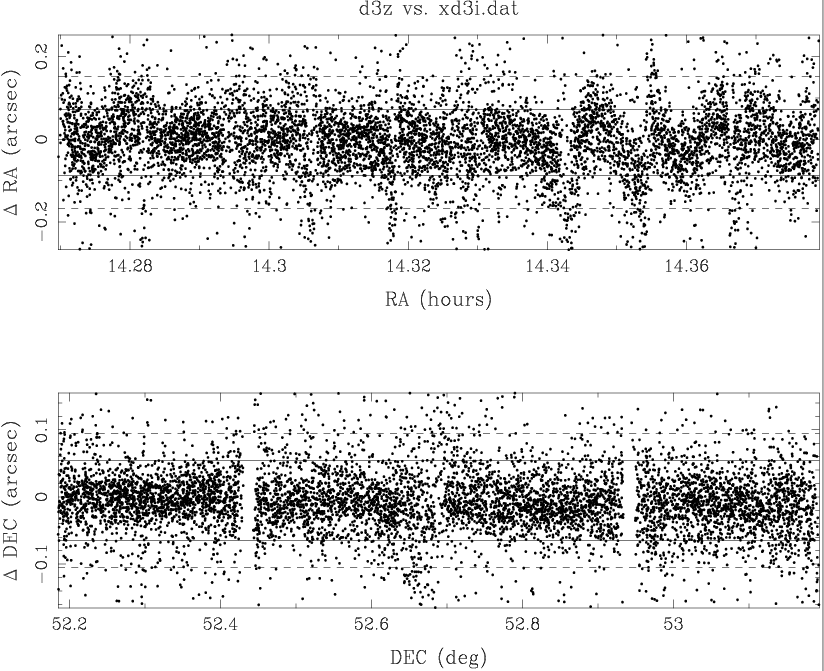 | |
| Colored gri image |  | ||||
| Number of images | |||||
| Total Exp. time | |||||
| Total area/
Effective area (unmasked) | 0.77 deg2 | ||||
| Averaged seeing | |||||
| Mag. ZP | |||||
| png image | 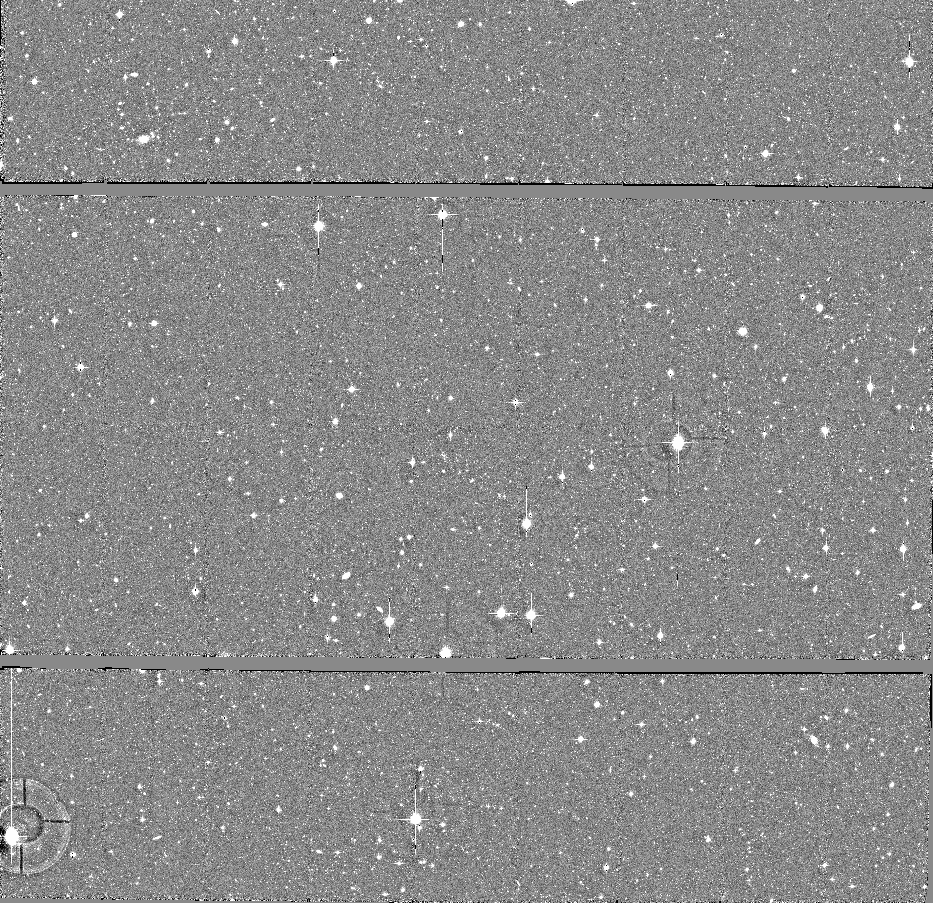 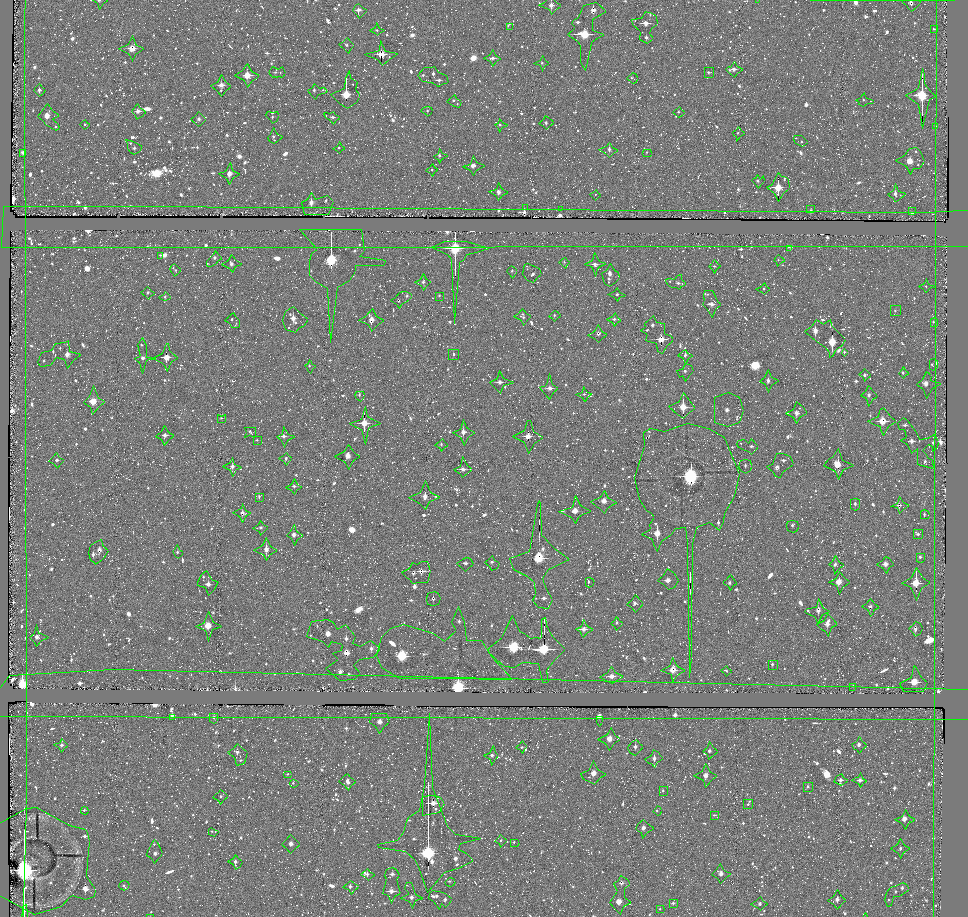 | ||||
| rh-mag plot | 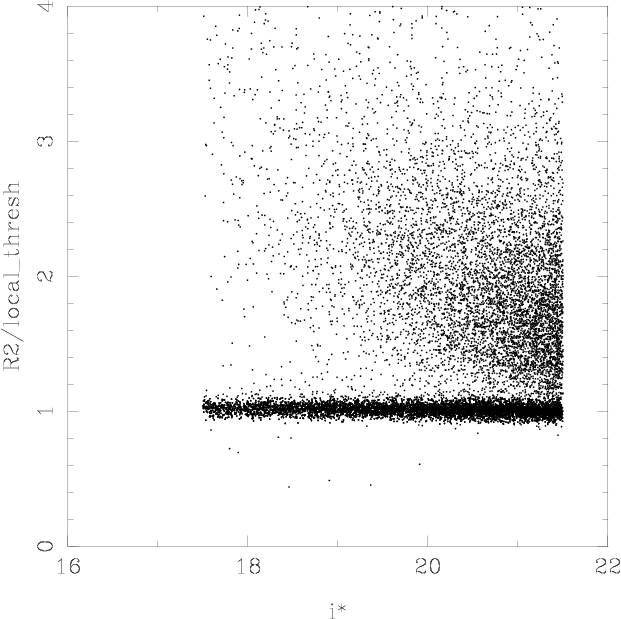 | ||||
| Galaxy counts | | ||||
| Stellar counts | | ||||
| Completeness | | ||||
| Stellar color-color plot | |||||
| Stellar 2-pts
correlation function | 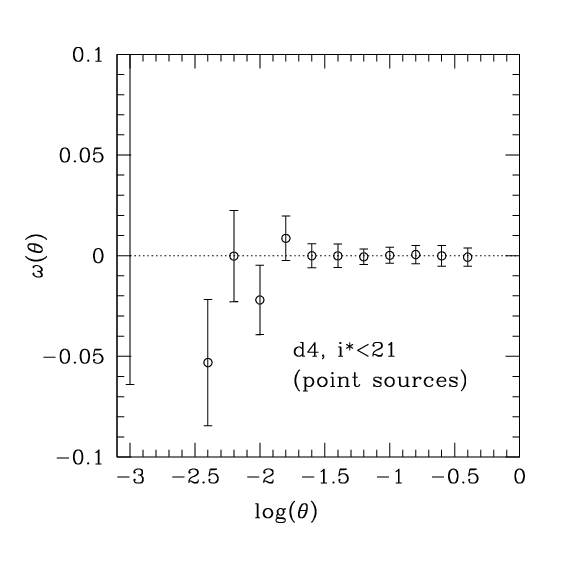 | ||||
| Number of images | |||||
| Total Exp. time | |||||
| Total area
Effective area (unmasked) | |||||
| Averaged seeing | |||||
| Mag. ZP | |||||
| png image | |||||
| rh-mag plot | 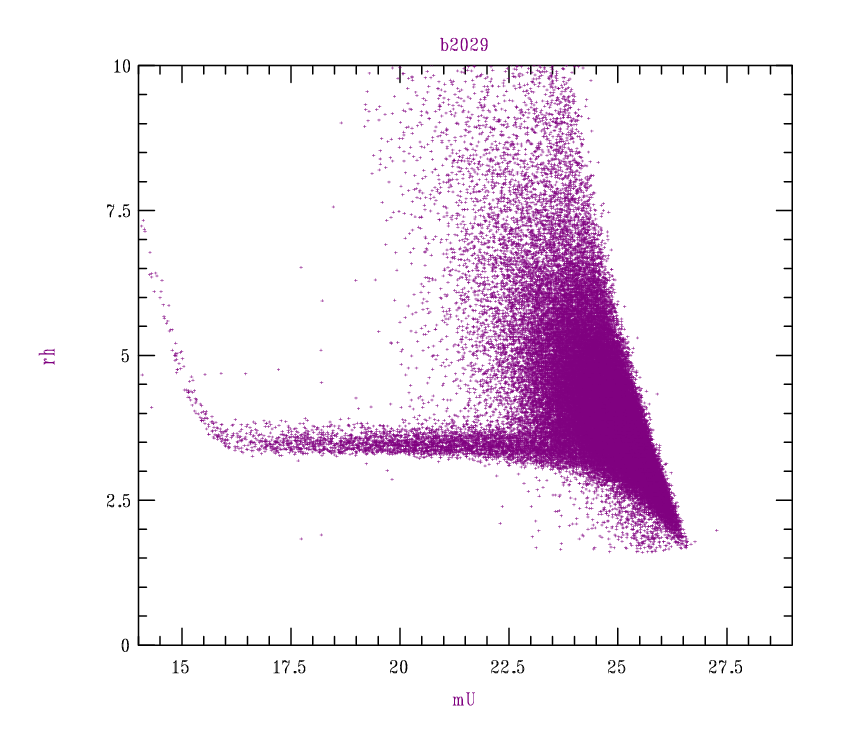 | 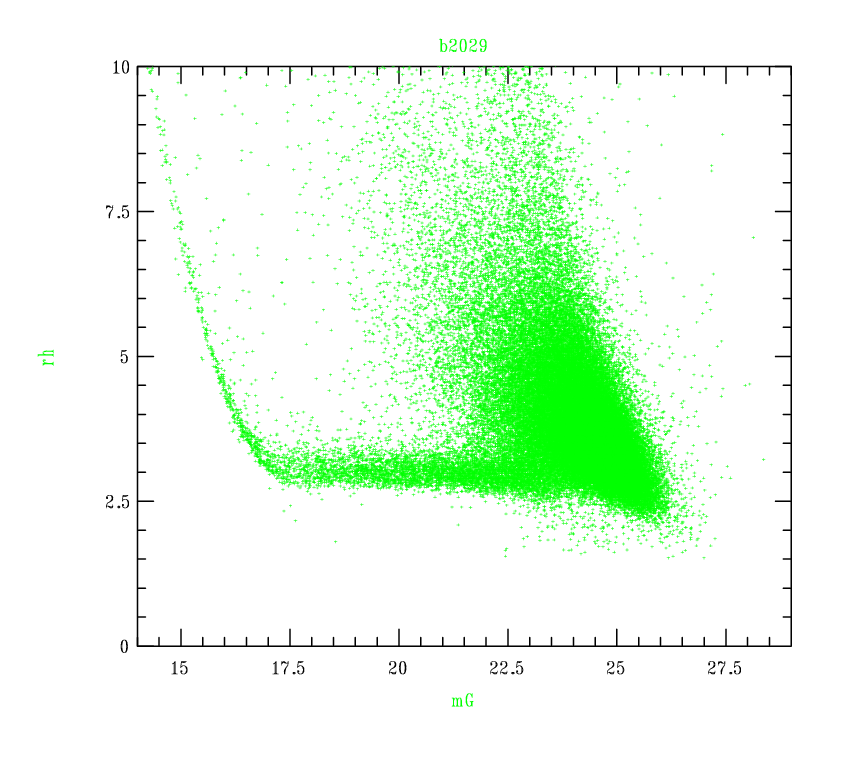 | 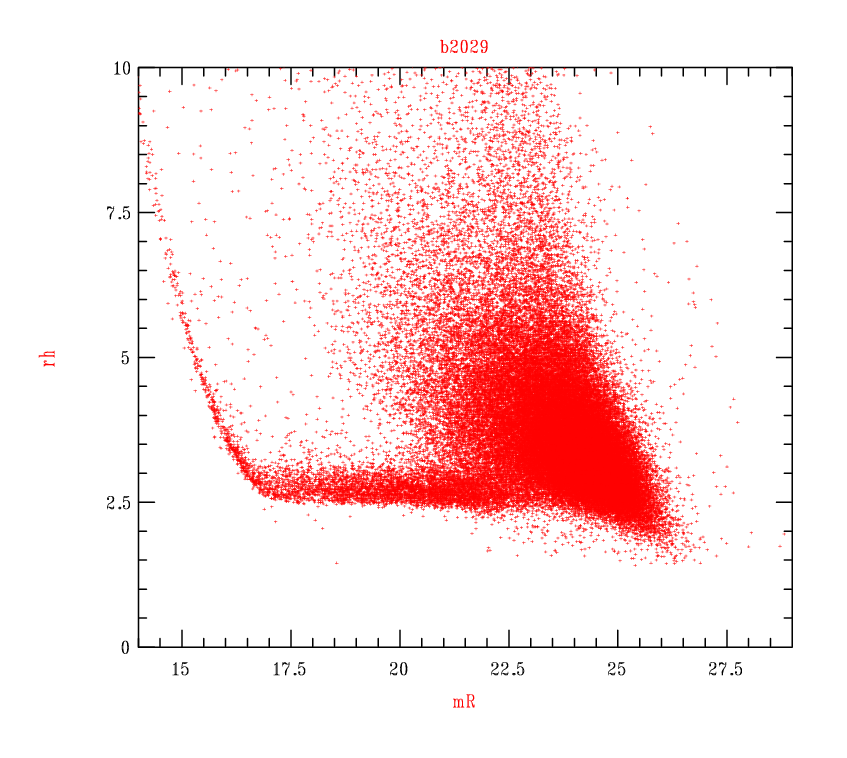 | ||
| Galaxy counts | |||||
| Completeness | 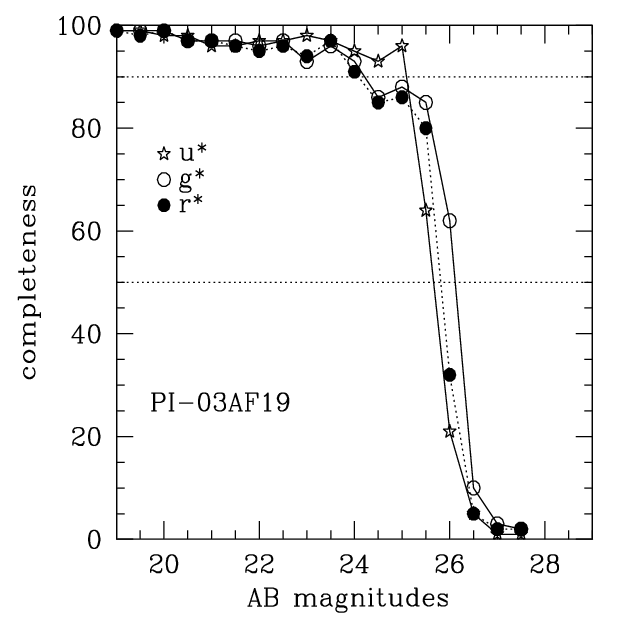 | ||||
| Stellar color-color plot |  | ||||
| Stellar 2-pts
correlation function | |||||
| Astrometric calibration: relative to r, and r relative to USNO | 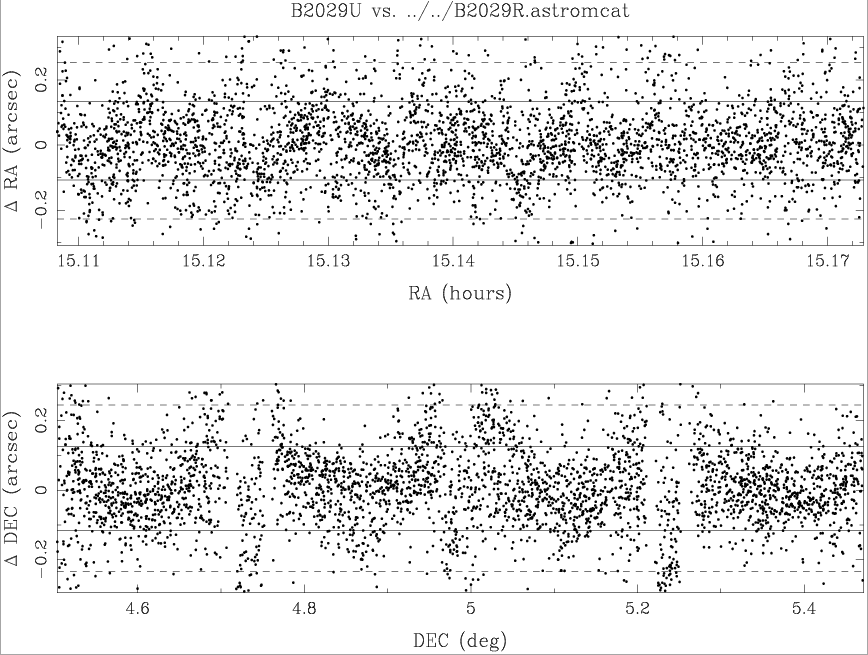 | 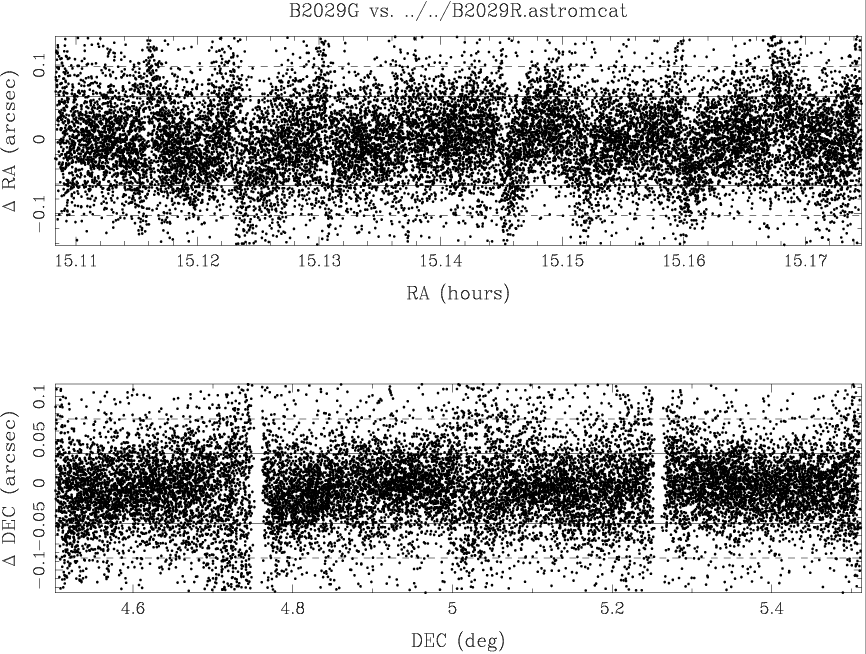 |  | ||
W3-0/W3-1/W3-2/W3-3 | |||||
| Number of images (W3:0/1/2/3) | |||||
| Total Exp. time | |||||
| Total area | |||||
| Total effective (unmasked) area | |||||
| Averaged seeing | |||||
| Mag. ZP | |||||
| png image | 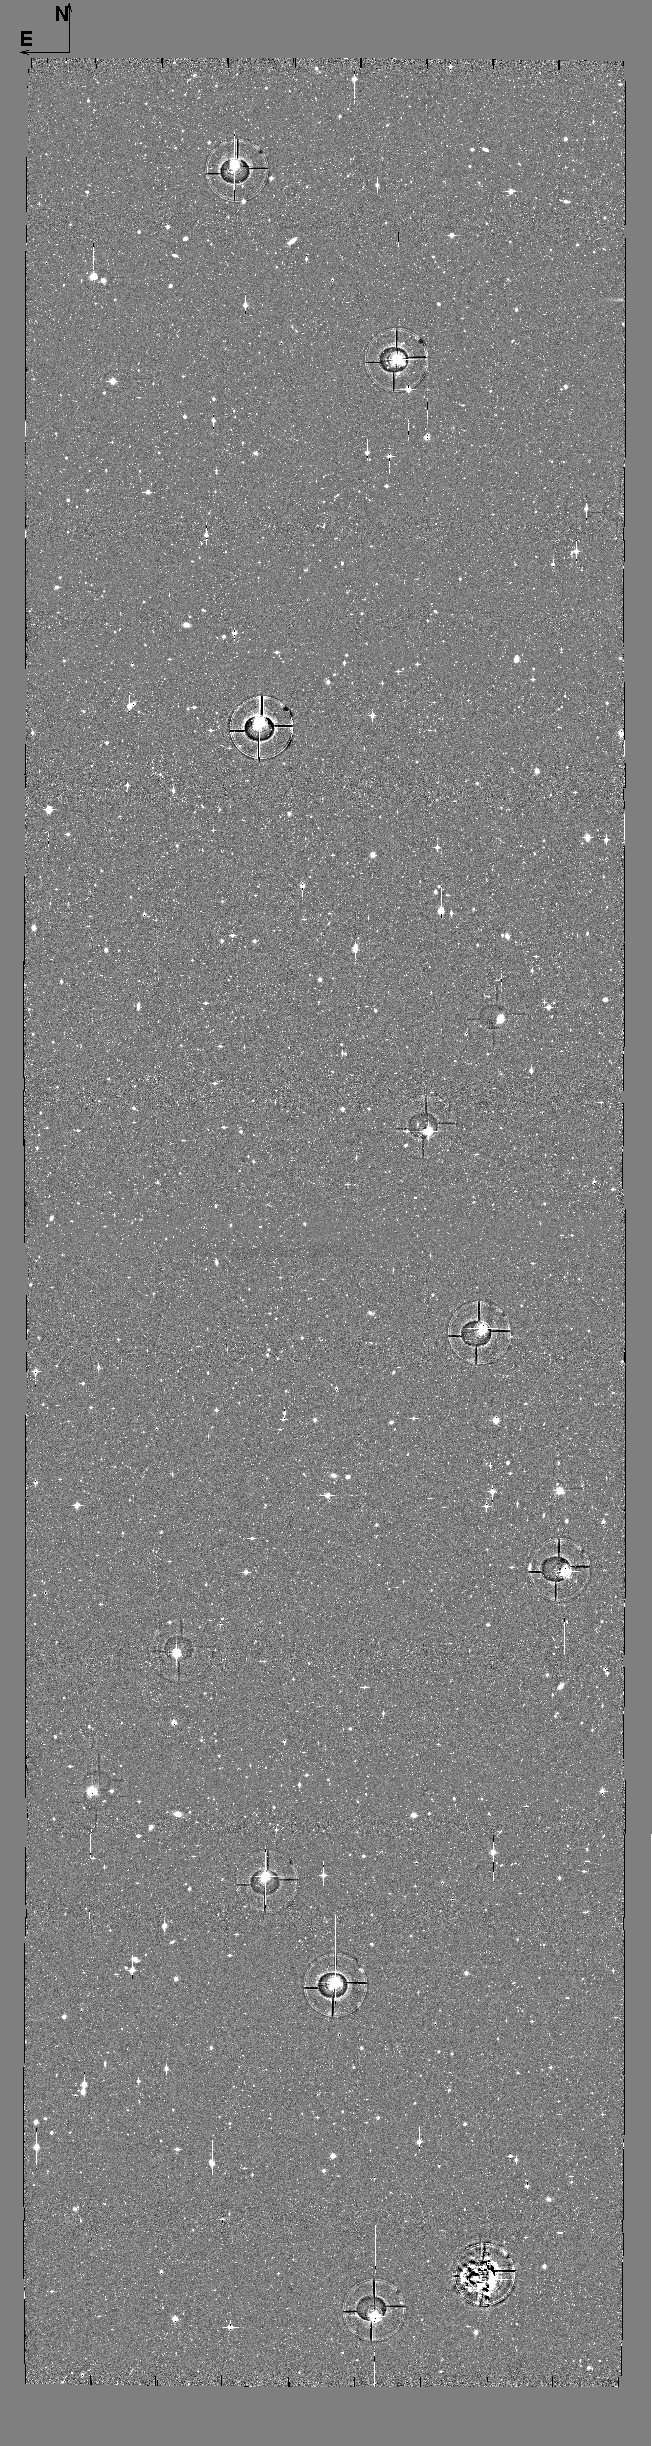 | ||||
| Seeing map | 
Ave.:0.917 Sig.:0.110 Min.:0.725 Max.:1.730 | ||||
| rh-mag plot | |||||
| Galaxy counts | 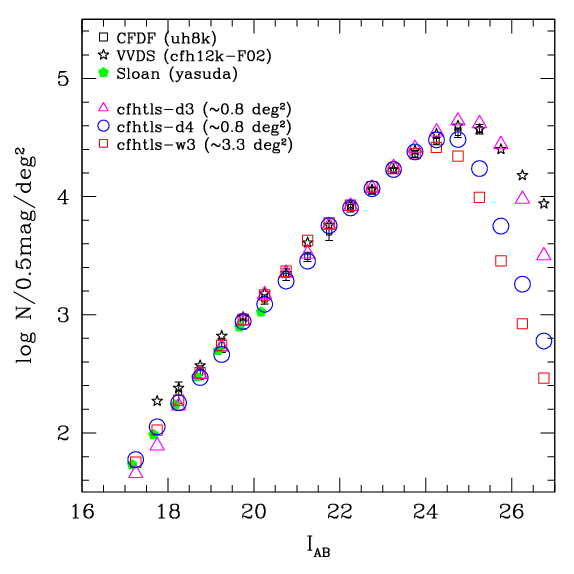 | ||||
| Completeness | |||||
| Stellar color-color plot | 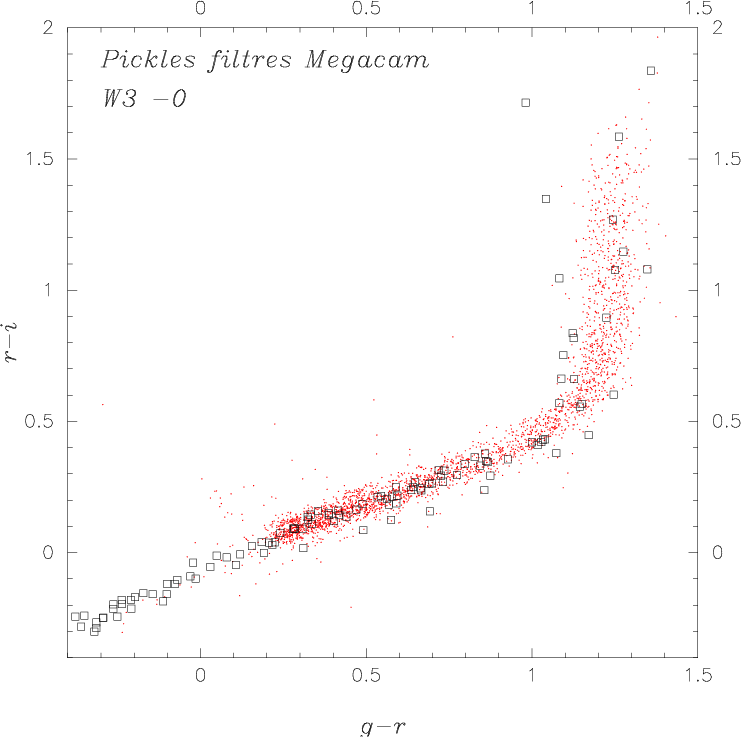 | ||||
| Stellar 2-pts
correlation function | |||||
| Astrometric calibration: relative to i, and i relative to USNO |  | 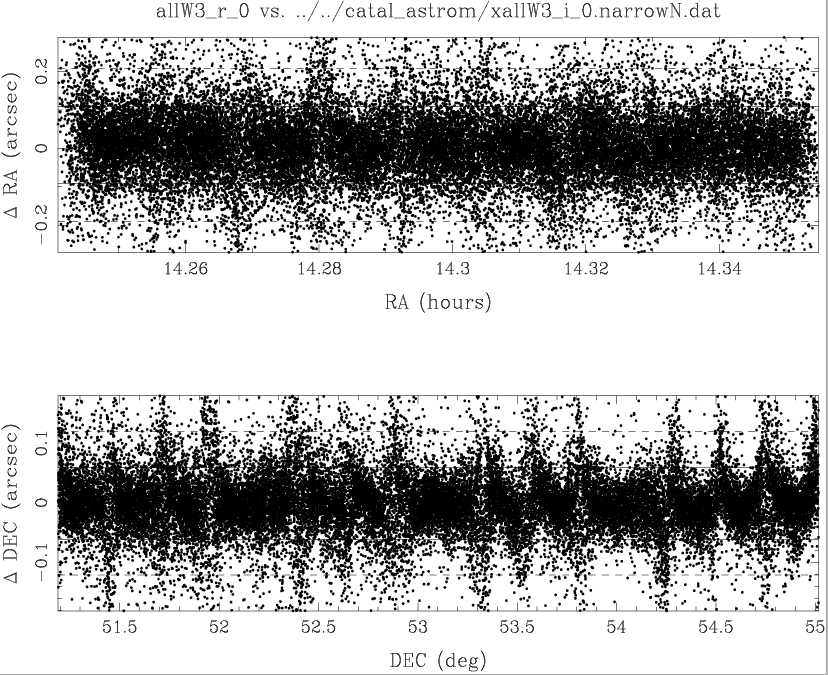 | 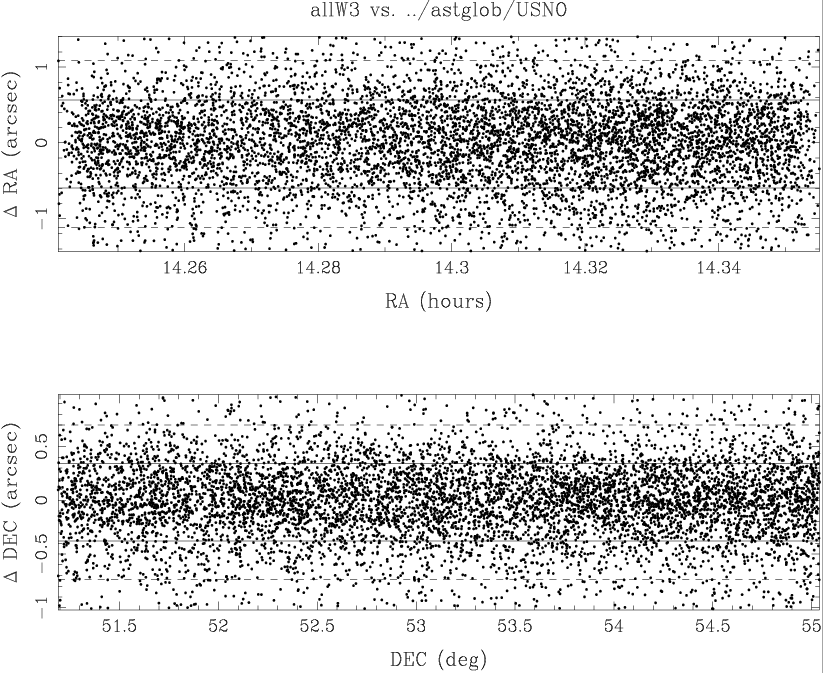 |
Short Explanatory document
2003A Performance evaluation release README (Paris, March 3rd 2004 - Last update March 17th)
This page presents preliminary stacks constructed from Megacam-CFHTLS data acquired during the 2003A observing runs. These data should be regarded as a 'work-in-progress' and are provided to allow interested parties to evaluate the actual on-telescope performance of Megacam and the TERAPIX reduction pipeline. We expect to release a new version of these stacks within the next few months. The TERAPIX reduction pipeline will be described fully in several articles currently in preparation, although the reductions outlined here broadly follow the spirit of those described in McCracken et al. 2001 (CFDF-I) and 2003 (VIRMOS). Please read the following notes carefully before attempting to using these catalogues and images for science!
The FITS images and relevant meta-data attached to them are archived at the CADC Performance Evaluation Release pages. They are publicly available to any C or F registered users.
The main steps in reducing this data were as follows:
![]() 1. CFHT's Elixir data arriving through CADC is ingested into the TERAPIX system. The quality assessment tool 'QualityFITS' is executed on each image, producing weight maps and image quality statistics (median FWHM over all chips, sky brightness and so forth).
1. CFHT's Elixir data arriving through CADC is ingested into the TERAPIX system. The quality assessment tool 'QualityFITS' is executed on each image, producing weight maps and image quality statistics (median FWHM over all chips, sky brightness and so forth).
![]() 2. All images are visually inspected and graded.
2. All images are visually inspected and graded.
![]() 3. The TERAPIX tool 'Astrometrix' is used to compute the linear and global astrometric solution.
3. The TERAPIX tool 'Astrometrix' is used to compute the linear and global astrometric solution.
![]() 4. The TERAPIX tool 'Photometrix' is used to compute the global photometrix solution. The magnitude zero points were computed using the PHOT_C and PHOT_K parameters provided by Elixir. Skyprobe data was used to select photometric exposures and the images were scaled to these photometric exposures.
4. The TERAPIX tool 'Photometrix' is used to compute the global photometrix solution. The magnitude zero points were computed using the PHOT_C and PHOT_K parameters provided by Elixir. Skyprobe data was used to select photometric exposures and the images were scaled to these photometric exposures.
![]() 5. Based on these astrometric and photometric solutions, the data is coadded using the TERAPIX tool 'SWarp'. The input images consist of the validated exposures selected in step 2, as well as weight maps generated by QualityFITS using the CFHT master masks and flats appropriate for the 2003A data. Images were *median combined* (currently, not all cosmic rays are successfully identified by QualityFITS, which means that a weighted mean still does not provide a cosmetically acceptable image). The output image has a constant pixel scale and was generated using a tangent-plane projection.
5. Based on these astrometric and photometric solutions, the data is coadded using the TERAPIX tool 'SWarp'. The input images consist of the validated exposures selected in step 2, as well as weight maps generated by QualityFITS using the CFHT master masks and flats appropriate for the 2003A data. Images were *median combined* (currently, not all cosmic rays are successfully identified by QualityFITS, which means that a weighted mean still does not provide a cosmetically acceptable image). The output image has a constant pixel scale and was generated using a tangent-plane projection.
![]() 6. For the other bands, the astrometric solution was re-computed using sources extracted from the i* band image, to ensure a high enough band-to-band astrometric accuracy.
6. For the other bands, the astrometric solution was re-computed using sources extracted from the i* band image, to ensure a high enough band-to-band astrometric accuracy.
"Post-processing" consisted of masking out all regions around bright stars, galaxies and also the gaps between the top and and bottom banks of CCDs (for the deep stacks, the total area available after masking is around 0.77 deg2). Bright haloes around stars were also removed.
![]() For the D3 stacks, multi-colour catalogues were constructed by running the TERAPIX tool 'SExtractor' in 'dual-image' mode, using weight-maps and stacks generated by SWarp and the i* band image as the detection image (these means, of course, that these catalogues are, i*-selected ones). Matched apertures were placed at the i* band position for each of the other bands.
For the D3 stacks, multi-colour catalogues were constructed by running the TERAPIX tool 'SExtractor' in 'dual-image' mode, using weight-maps and stacks generated by SWarp and the i* band image as the detection image (these means, of course, that these catalogues are, i*-selected ones). Matched apertures were placed at the i* band position for each of the other bands.
![]() For the D3 data, images with median seeing (as measured by QualityFITS over all CCDs) of less than 1.2'' were used.
For the D3 data, images with median seeing (as measured by QualityFITS over all CCDs) of less than 1.2'' were used.
![]() For the D4 stacks, only images 'within spec' for the CFHTLS were used, i.e., those with a median seeing less than 0.9''.
For the D4 stacks, only images 'within spec' for the CFHTLS were used, i.e., those with a median seeing less than 0.9''.
![]() The W3 field is composed of 4 joined Megacam data sets, aligned along the Declination axis. They are labelled as W3-0, W3-1, W3-2 and W3-3. Each field has a number of image and a total exposure time. We give information for each, as a quadruplet: W3-0/W3-1/W3-2/W3-3/W3-4, when necessary.
The W3 field is composed of 4 joined Megacam data sets, aligned along the Declination axis. They are labelled as W3-0, W3-1, W3-2 and W3-3. Each field has a number of image and a total exposure time. We give information for each, as a quadruplet: W3-0/W3-1/W3-2/W3-3/W3-4, when necessary.
The W3 series correspond to, from South to North, W3-0-3, W3-0-2, W3-0-1, and W3-0-0 of W3 sequence shown on the CFHTLS Wide web page: CFHTLS W3 targets . The 4 fields extracted from the DDS data can easily be identified on the png i-band image attached to the W3 performance information.
The stacked image W3 is first generated using the whole 1 x 4 deg2 field at once. Because W3 image is too big to be handled by most user computers, it has been cut into W3-0, W3-1, W3-3 and W3-4 sub-images of 1 deg2 each. However, we only produced one single homogeneous catalog that contains ALL W3 galaxies. The (RA,DEC) are correct, but users must take this into account when handling (X,Y) coordinates, in particular when these images are visualised.
************** **Caution!**** **************
For various reasons, the residuals in the astrometric solution in the zones between CCDs are above specifications (in these zones the residuals may be larger than 0.05''). In this region band-to-band colours may be inaccurate. For this reason, any study requiring accurate colours over the entire Megacam field should carefully examine these regions (the masks which we provide does not exclude these regions, because they were prepared for i*-selected catalogues).
Notes on the plots
All plots are presented in Megacam *instrumental* magnitudes, using the zero-points provided by Elixir. No attempt has been made to transform to other magnitude systems.
![]() Galaxy counts and stellar colour-colour plots
Galaxy counts and stellar colour-colour plots
For object magnitudes, Kron-like 'total' magnitudes are used throughout, as computed by the MAG_AUTO parameter in sextractor. Star-galaxy separation was performed using the half-light radius parameter on the i* to locate the stellar locus. To account for the variation in Megacam's PSF as a function of position, maximum half-light radii were computed in 15' boxes distributed over the field.
![]() Stellar counts plots
Stellar counts plots
Stars are selected as described in the previous paragraph. Magnitudes are AB system. The counts are compared to the Besancon's model. Details can be found at the URL : Besancon models . The model predictions have been made in the SDSS filter system, hence they are probably slightly shifted (may be from 0.1 to 0.2 magnitude in i).
![]() The seeing map provided for W3 gives the median 2 x half-light radius x 0.186" computed in bin of 10' x 10'. The best seeing area is white, the worse is black.
The seeing map provided for W3 gives the median 2 x half-light radius x 0.186" computed in bin of 10' x 10'. The best seeing area is white, the worse is black.
![]() Completeness calculations
Completeness calculations
Completeness was measured by adding, for each half-magnitude slice, 1000 randomly positioned point-like sources (with Moffat profiles) to a sub-section at extracted at [6000:9000,6000:9000] of the large stacked images. Sextractor was run on this sub-section, and the numbers of stars successfully recovered measured (the sextractor detection parameters were the same as were used to construct the full-field catalogues). These input objects have a uniform distribution in magnitude and position (no attempt was made to measure the expected position-dependent completeness of the Megacam mosaic; this will be attempted in future analyses). The FWHM of each simulated source added corresponds to the FWHM at the position of the mosaic.
![]() Stellar angular correlations
Stellar angular correlations
The angular correlation function of stellar sources was computed using the usual Landy and Szalay estimator.
Any questions or problems with these catalogues, or the plots, please contact us at terapix@iap.fr or hjmcc@iap.fr.